

For a stretch last month, it seemed like the Atlantic would spit out a major hurricane on the U.S. mainland every week. So far this year, we’ve seen four (major hurricanes being classified as Category 3 or higher) and a total of 10 in 10 weeks. The season doesn’t end until Nov. 30, and there’s a solid chance this year will wind up yielding the costliest mainland hurricane season in recorded history.
This year’s spike in powerful hurricanes has pushed emergency personnel to implement new ways of dealing with storm fallout. Among the most prevalent has been geographic information system (GIS) mapping. Affected areas have found several uses for the technology to reinforce recovery efforts.
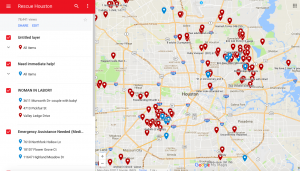
Rescue and Assistance Maps — Texas, Hurricane Harvey
Hurricane Harvey hit Houston and its surrounding areas hard, with many spots in the metropolitan area receiving 30 inches of rain or more. At least 30,000 people were displaced and nearly 20,000 needed rescuing.
To help pinpoint those in need of assistance, civilians took it upon themselves to set up Google Maps. The app allowed those who were stranded to mark their location and provide information on the severity of their conditions. One of the most popular of these maps, Rescue Houston, included tags like “WOMAN IN LABOR!!” and “Need Immediate help!”
Some location points are as simple as an address, a name and a phone number. Others are direr: “couple with baby in need of rescue, report power lines down in surrounding water. running low on babys [sic] food. please help asap!”
It’s unclear exactly how much rescue workers relied on these pinpoints, but officials there have commended the initiative that ordinary people took to help out.
This sort of mapping is also being used in recovery efforts for area property. The Texas Muck Map provides a similar service for those whose homes need mucking, of the process to prepare a flooded home for drying out and renovations.
Flood Area Survey Points — Florida, Hurricane Irma
Miami has made slightly different use of GIS. In the wake of Hurricane Irma, the city has put its GIS software to use in surveying flood points.
On the map, powered by Esri’s ArcGIS technology, colored dots line the city’s coast. Each dot corresponds to an exact location in the city, as well as flood depths. Some dots include comments from their inputters. For example, one states: “Talked to residents who said the storm surge only came in about 6 feet.”
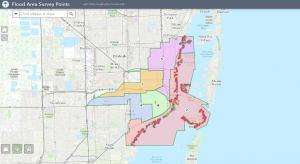
Some dots also include pictures that show flood lines and debris-covered areas. It’s unclear whether the data points were inputted primarily by city workers or volunteers, but it’s a great example of visualizing data in the aftermath of a powerful hurricane. Anyone can view the map and add data points.
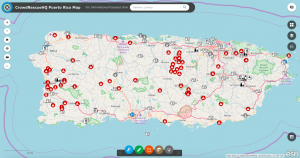
CrowdRescueHQ Map — Puerto Rico, Hurricane Maria
Puerto Rico has a long road to recovery. The Caribbean island had enough trouble on its hands with aging infrastructure and a debt crisis to the tune of more than $70 billion. Then came two hurricanes.
On Sept. 7, a Category 5 Hurricane Irma clipped the island and left a million people without power. Two weeks later, a slightly smaller but even more devastating Hurricane Maria (Category 4) hit dead-on at near peak intensity.
CrowdRescueHQ, a data map built on Esri’s ArcGIS software, gives a shocking snapshot of what the devastation looks like from above. The map includes data points for a number of factors, including areas in need of water, or those that have water available. It also shows spots with working power and cell service, and other infrastructure issues, such as blocked roads and overflowing sewers. Some of the data points appear to be aggregated from Facebook and Twitter sources.
At the center of these disasters is the Federal Emergency Management Agency (FEMA), which has also begun using GIS in its response efforts. It’s an upgrade from the old practice of passing static maps from department to department.
If FEMA’s adoption of the tool is any indication, we can expect more frequent use of interactive data in future disaster relief efforts. The technology makes it easier than ever to evaluate the extent of damage, target rescue efforts and more holistically view an area post-disaster.
That’s reason enough to keep watching.
On Oct. 21, FEMA will host a free Disaster Crowdsourcing Exchange — you can register as an in-person or virtual participant.


Has anyone considered, in the plans to rebuild the hurricane-affected areas, more resilient infrastructure changes? Particularly with respect to PR and USVI, much more stringent building codes, an underground power grid, weather-resistant emergency shelter and storage facilities, etc., even some of the heavy equipment being used currently for cleanup could be stored in place for future events. We could use this opportunity to completely revamp these islands into a more vibrant and modern, but storm-ready, commerce and resort communities. In chaos, opportunity.
I think you’re absolutely right that PR and USVI can come out of this better than before. The widest-reaching news story I’ve seen in regards to an innovative rebuilding process comes from Elon Musk of Tesla/SpaceX, who’s offered to revamp PR’s power grid with solar technology. And Tesla has actually already shipped a few hundred battery packs to the island to help stabilize recovery efforts until the power is more widely restored.
I’ve also seen a few op-ed columns for infrastructure improvements making the rounds — this one gives some solid insight into PR’s position specifically. I haven’t seen much from U.S. elected officials, except in pushing for a task force to evaluate a long-term development plan.
It’ll be interesting to see what long-term recovery plans look like. Does seem like these islands could become best practice case studies in resilient city planning. In chaos, opportunity indeed.