When “Full Coverage” Isn’t Full: Why Rancho Mirage Is Mapping Wireless Gaps
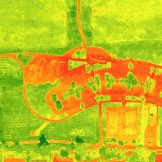
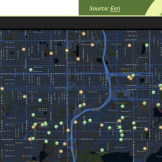
Rancho Mirage uses GIS to uncover wireless coverage gaps. The city’s maps of cellular performance helped residents understand service quality, guide infrastructure planning, and accelerate collaboration with wireless carriers to expand reliable connectivity across a fast-growing desert resort community.