We can’t control the disasters we encounter; we can, however, control our response. At Esri’s recent Public Sector CIO Summit in Redlands, California, three county leaders explained how they’ve responded to various disasters with the assistance of geographic information system (GIS) technology.
In 2018, Bay County, Florida was hit hard by Hurricane Michael, the fourth largest hurricane to hit the U.S. coast, according to the Washington Post. Christopher Fox, IT and GIS Director of Bay County, and his team were aware 72 hours out that the hurricane was fast approaching. Unfortunately, 24 hours out, windspeeds increased, taking the hurricane from a category two to a high category four. This was a massive hurricane, spreading over 100 miles in radius and bringing sustained winds of 155 miles per hour.
“We are still in the recovery process and still have a long way to go,” Fox said. “To date, we have collected over 14 billion pounds of debris.”
The storm dramatically altered the landscape, and the local government wasn’t quite prepared for it. Bay County is rather small, with a population of 180,000 and a total area of 1,000 square miles. The local GIS team is made up of four individuals, who were able to upload data to Esri’s GIS platform to help them respond to this disaster. However, once the storm hit, the four internet access layers that the team had set up were all disrupted. The team also lost communications, mainly landlines and cellphones, although radios held up.
“We were completely in the dark,” Fox stated. “We had to realign and reposition after the storm.”
Jose Lopez, Division Director of Enterprise Solutions of Miami-Dade County, Florida, also had to deal with the consequences of a high category hurricane: Hurricane Irma. It was “one of the strongest and costliest hurricanes on record in the Atlantic basin,” according to a report from the National Hurricane Center. The department was unprepared at the time for the 47 million hits to their website that slowed down community services applications.
“Esri helped us get everything to the cloud on the fly and everything is working really well,” Lopez said. “We’ve learned from that and we should now be able to handle anything.”
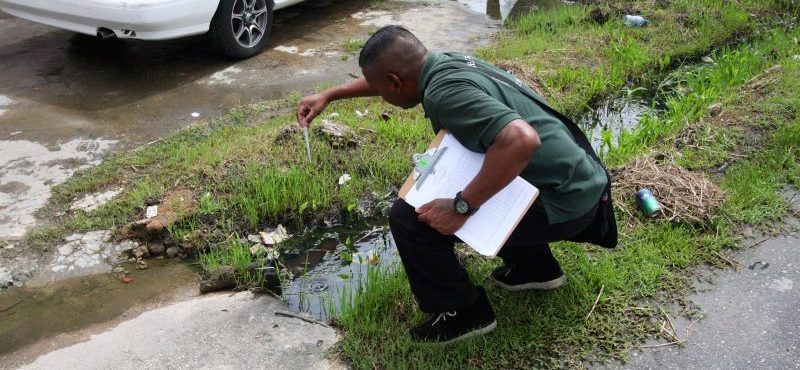
Two years ago, Lopez and his team also had to deal with the Zika outbreak. They had already started looking at the area under mosquito control and tried to digitize their system, with an eye for bringing the department to the GIS world.
However, everything that the department did was paper-based. When a call came in, someone manually went into Google Maps to locate it and assign an inspector to it. Inspectors had to work with printed out maps that they wrote their notes on. Eventually, the information would be keyed into the system. The team was processing about 4,000 calls per season; that number tripled when the Zika outbreak occurred.
Lopez and his team created a web map with all of the information that the department had, so they could get used to operating digitally. While that was happening, they started building solutions for the department so they could eventually automate the call-and-response process. Now when a call comes in, the inspector receives the assignment via a collector app. The inspector can see himself and navigate to where he is needed, and the department can see what he’s doing in real time and draw statistics from it.
One benefit that arose from simplifying the process was cutting out the contractors and the contractors managing the contractors. All of the work is now done by county staff.
Dana Carey, Office of Emergency Services Coordinator of Yolo County, California, had to do things entirely in-house from the start. When she first became manager, she received funding to work on some mapping projects. However, during that time, she had no GIS staff on hand. She had to learn GIS herself, and some of the very first tools her department has are the ones she programmed.
“Every time I show off one of the tools that we originally created to make our lives easier, all of my counterparts want it,” Carey said. “We’ve been sharing our tools through the group environment in ArcGIS online with counties and cities all over California.”
Photo Credit: Pan American Health Organization (PAHO) via Flickr


Leave a Reply
You must be logged in to post a comment.