

Traffic fatalities rose even as driving decreased in 2020, according to the National Transportation Safety Council. This sobering fact has transportation planners stepping up their safety initiatives — especially for pedestrians.
StreetLight Data — a data analytics company that uses geospatial (GIS) data to transform urban planning and transportation design — turned to their vehicular and pedestrian metrics to uncover key insights that could help. This granular analysis revealed the top 20 American cities with most walking per capita, unexpected COVID-driven shifts in pedestrian travel nationwide, and a fresh way to evaluate increased exposure, with an example of how this approach played out in Orlando, Florida.
Most transportation departments don’t have extensive data for pedestrian and bicycle travel, and therefore can’t effectively prioritize countermeasures. Localities that do track pedestrian metrics may not have the resources or nuanced crash data to apply a Federal Highway Administration “KABCO” ranking to individual zones. Armed with only rudimentary data, it can seem appropriate to equally prioritize zones with, for example, similar crash volumes.
StreetLight Data’s analysis suggests a different direction. The top city for pedestrian activity on StreetLight Data’s Climate Index list is Orlando. Probably not coincidentally, Orlando is also ranked as the most dangerous pedestrian city in the country by the nonprofit, Smart Growth America, which creates its annual Dangerous by Design pedestrian danger index.
To uncover its high-exposure areas, StreetLight Data combined Orlando’s pedestrian crash data from 2016 to 2018 with its pedestrian trip volume data.
Focusing on two zones with almost the same number of pedestrian crashes: Orlando’s central business district (six crashes) and the Holden Heights area (seven crashes), about a mile to the southwest.
In 2019, the zone near the Holden Heights area actually had much lower pedestrian activity overall. In contrast, the central business district zone had significantly more pedestrian activity – 15x the trips of Holden Heights, in fact.

Comparing the amounts of pedestrian activity with the number of pedestrian crashes for the two zones shows Holden Heights with a much higher pedestrian-to-accident exposure ratio. The central business district may have had a similar number of accidents, but because it had 15x more pedestrian activity, it has a lower pedestrian-to-accident exposure ratio than Holden Heights. In other words, a pedestrian walking in Holden Heights is 19 times more likely to be hit by a vehicle than if they walked downtown.
The central business district is clearly able to handle large amounts of pedestrian activity in a safe manner, while the built environment or other local factors in the Holden Heights area cannot.
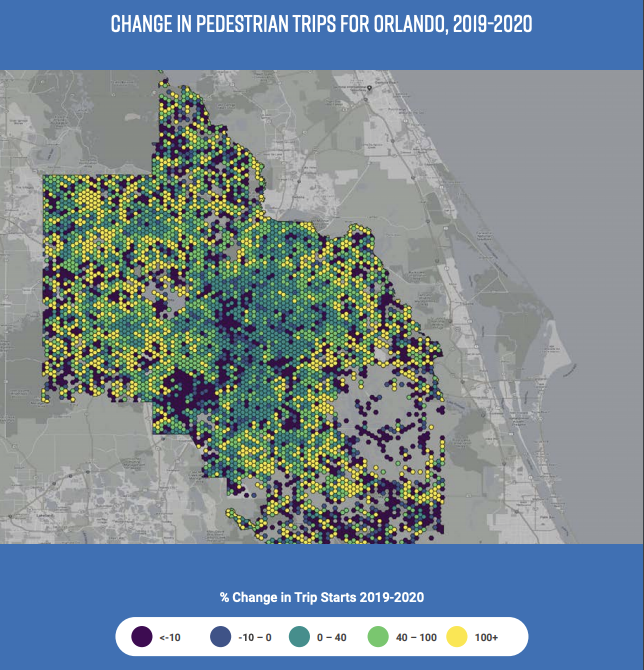
Orlando’s change in pedestrian activity over the past year shifted anywhere from a 50% drop to a 30% increase depending on the block. Safety-minded transportation planners will need to re-analyze in order to prioritize zones where investments and improvements would have the biggest impact in the years to come. They will also need to reevaluate their models now that data older than 2020 is not applicable to current conditions.
This blog post is an excerpt from our new partner report, “Pedestrian Top 20 Cities: How Safe Are Your Streets?,” to learn more about analyzing new pedestrian safety metrics, as well as 2020’s Top 20 cities ranked by amount of pedestrian activity, download the full report here.
Featured image by Talia via Unsplash; story images by StreetLight Data


Thank you for sharing this valuable insight. I do live in Orlando, and it is not a pedestrian friendly city. I walk to work, and drivers do not respect pedestrian crossings. Over 15 years ago, there was a transportation referendum that did not pass. There was discussion of another transportation referendum that has now been placed on the back burner with Covid.