The National Library Service for the Blind and Print Disabled (NLS) is undergoing perhaps the largest modernization effort since its founding in 1931.
Strategic data use is central to the effort. And in 2019, NLS onboarded its first data and analytics officer, David Spett, to help.

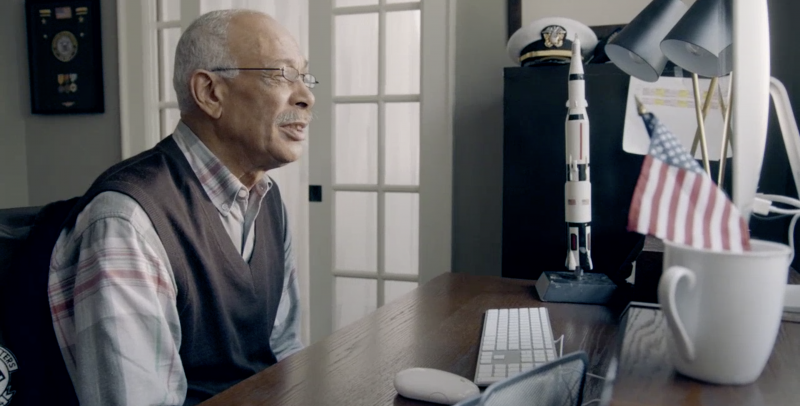
David Spett, Data and Analytics Officer, NLS
NLS has served patrons with low vision, blindness and other disabilities for nine decades. Although data can certainly bring transformation, Spett emphasized that it serves as a “great complement to institutional memory and knowledge.”
“Ideally, data will inform our decisions and operations, but it does not fundamentally change the services we provide and the way government operates,” Spett said.
In March 2021, GovLoop interviewed Spett to get a peek into his experience helping NLS become more data-informed and mission-effective.
The interview has been lightly edited for clarity and brevity.
GOVLOOP: So you are in a newly created role. How were you first brought in as the data and analytics officer?
SPETT: We are 90 years old, and we have been operating with a unique model since our founding. We provide library materials to Americans and individuals with disabilities. And we generally ship those materials around the country — print braille and audio cartridges via mail.
Now, we’re going through an organizationwide modernization that is probably the biggest change in our operating structure since we’ve been founded. And we are shifting from a predominantly U.S. mail-based delivery mechanism to a predominantly online streaming-based mechanism.
The idea with creating my position was to ensure we had the right data organizationwide to serve our patrons as best as possible, to make sure we are providing them with everything they need throughout the course of this modernization.
Data touches so much, and you are just one person. So what does your typical workday look like?
I completely agree that data touches so much. And you could argue it touches almost everything we do on a day-to-day basis.
Something I’ve discovered is that there’s almost an unlimited amount of potential work I could do at any given time. There is always more data to analyze and study. And so my day is really about prioritization, because I obviously cannot do everything. When I make decisions about prioritization, I gather input. I look at where I can have the most impact to help drive the most important decisions. I look at what the biggest problems that the organization needs to solve are and, in particular, what our strategic plan calls for.
What impact has data analysis had at NLS so far?
We are lucky to have a good number of staff who have been with the organization for a long time. They have a lot of institutional memory, and they really understand the practices and traditions of our organization and our service model. They also have some preconceived notions about the way things are, and why they are that way.
Sometimes what we find when we analyze rigorously gathered data is that those preconceived notions may be correct, but they also may not be — and the data might suggest that we go in a different direction.
Data is really instructive at serving as a great complement to the institutional memory and knowledge that I mentioned, as we go about making decisions with respect to the modernization.
What has the data shown so far? Has it challenged some preconceived notions?
One of the questions we’re working through now is how much and what kind of assistance our patrons will need to adapt to a streaming model. Will they need hardware, software and training, or just a subset of these different items?
Data has suggested to us that, actually, a greater proportion of patrons than we thought already have a smartphone or some Wi-Fi. This tells us that patrons are likely to need a little less of a leg up — that we can simply provide them with an app or materials to stream. The data we gathered enabled us to understand that we may not need to provide some of the hardware we thought we needed to provide in the past.
How do you try to marry data analytics with institutional knowledge, as you mentioned, in your work?
I find that working collaboratively is really helpful. My work is improved when I have the opportunity to hear from and obtain input from my colleagues, particularly those with the organizational knowledge and history of [NLS]. That can both inform my analysis and help me better understand what data-gathering processes may be ideal and what may not be ideal.
Now that you’ve been in your role for about two years, what are some effective ways you’ve learned to communicate using data?
I find it’s really helpful to share information in multiple ways, often through narrative and visualization. I like tables, graphs and charts, but I also like to provide narrative explanations of those visualizations. We have a number of blind staff, including NLS’ director, so it’s really important that whenever I provide a visualization, there’s also a narrative.
It’s important as well not to just share the data itself, but to take it one or two steps forward and explain what it means. What are the implications for our current decision-making and our organizationwide strategic goals?
What do you want employees or leaders who don’t have explicit data-related roles to know about data?
What I would say to employees who don’t have data-related roles is that, ideally, data will inform our decisions and operations, but it does not fundamentally change the services that we provide and the way government operates. I would look at data and data-informed decision-making as an evolutionary process, not a revolutionary process. It’s not something to be afraid of, but something that can help us all be better at our jobs.
This article is part of GovLoop’s recent guide, “Advancing the Art of Data Analytics.” Download the full guide here.
Photo credit: NLS promotional video


Leave a Reply
You must be logged in to post a comment.