
![]()
Lean Six Sigma (LSS) is an approach to quality improvement that aims to eliminate waste and variation from a process. Imagine a bakery selling chocolate chip cookies. The three bakers each use a different recipe and they bake more than the bakery can sell. Not only is the bakery losing money on unsold cookies, but they could be using their bakers more efficiently by having one specialize in cookies while the others bake additional goods.
Excessive cookies might not be a bad thing, but in the public sector, waste and variation can lead to serious problems in workflow and project management. Learning these three LSS tools can help you efficiently map out projects, identify problems and implement effective solutions.
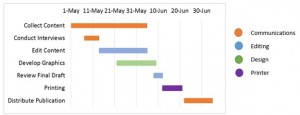 Gantt Chart – Gantt charts are visual project timelines. Map out the tasks needed to complete your project, when each task needs to start and how long it will take to complete. Putting this information into a Gantt chart shows how delays early in the project can push back future tasks and how some tasks can overlap. There are excellent templates available for Microsoft Excel or you can create your own using this quick tutorial.
This example shows a few of the tasks needed to successfully distribute a publication. The chart shows the overlap of tasks, such as editing while continuing to gather content, and it shows the team or individual responsible with a color-coded legend. Gantt charts can help keep a project on track by visualizing each step of the process.
Fishbone D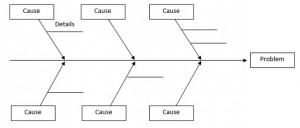 iagram – Sometimes called “cause and effect” diagrams, fishbone diagrams are helpful when problem solving. Using the previous example, let’s say our publication wasn’t distributed on time. You won’t need to use a fishbone diagram if the publication got delayed at the printer, but what if the delays were in the content development phase? You may want to drill down to discover the root causes of the delay and if there are opportunities to improve your processes.
To fill out your fishbone:
1. Write your problem statement on the right.
2. List some categories that contributed to the problem. These will be the causes in the fishbone branches. Common categories include: environment, equipment, measurement, materials, people, and method/process.
3. Under each cause category, elaborate and list details.
4. Review the details and highlight those that had the biggest impact on the problem. These are the areas to focus on improving.
The fishbone diagram below shows the overall structure, and an example of an important detail that contributed to our problem statement.
Impact-Effort Matrix – So you’ve identified your problem and come up with a few potential solutions and projects. Using an impact-effort matrix can help review those solutions to identify which will be impactful and the best use o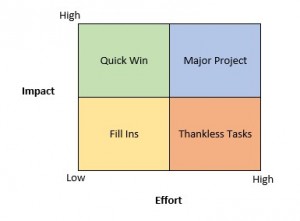 f your efforts. Think about how much time and energy this project may take. Is the potential impact worth that time?
Consider drafting a Gantt chart for an upcoming project, drilling into a problem with a fishbone diagram or pulling out the impact-effort matrix during your next brainstorming meeting. These three LSS tools are impactful and easy to use with a little practice – quick win!
Kaitlyn Boller is part of the GovLoop Featured Blogger program, where we feature blog posts by government voices from all across the country (and world!). To see more Featured Blogger posts, click here.


Cool post Kaitlyn, I’d never even heard of LSS but it seems there’s a lot to be gained here.
Thanks Alexa – LSS is used a lot in the automotive industry and in health care, but the tools can be useful to anyone working on projects!
Nice post.. and good info to share. The basics of LSS appear to apply to most anything we touch. Thanks.