
To create infographics, it used to be that you needed some intense skills with Adobe Creative Suite or the budget to hire a designer.
Working with a professional designer still has its advantages, especially if your infographic project is complex or if you don’t have any talent for visual design. However, if you want to create your own infographics, there are now many free online tools that make it easy.
You’ll still need time and patience to design an infographic yourself, but these infographic tools can go a long way to getting you started. If you need a little infographic inspiration, check out these awesome government infographics.
I tried out dozens of free infographics so you don’t have to. These are the four I like best.
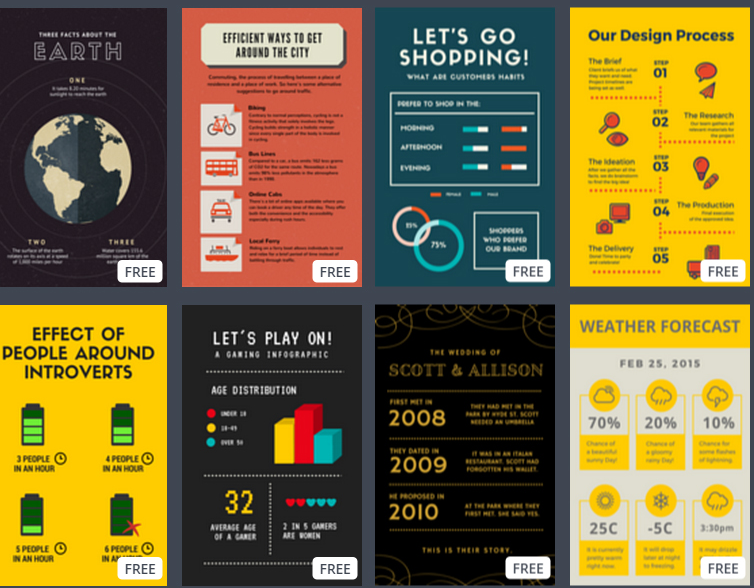
Piktochart
Piktochart has a free plan with a lot of features as well as a Pro package with even more, and proudly offers discounts for nonprofits and education. The free account comes with a nice variety of templates, with the occasional timely new designs related to popular topics. It has many icons, photos, backgrounds, photo frames, charts, and fonts—and is one of the few infographic tools that includes maps of continents and some countries for free. You can also upload up to 20 of your own images to use in your design and download your finished infographic at a resolution just right for viewing on the web.
If you need more templates, or want a watermark-free, print resolution, or PDF version of your infographic, then the Pro version of Piktochart is for you.
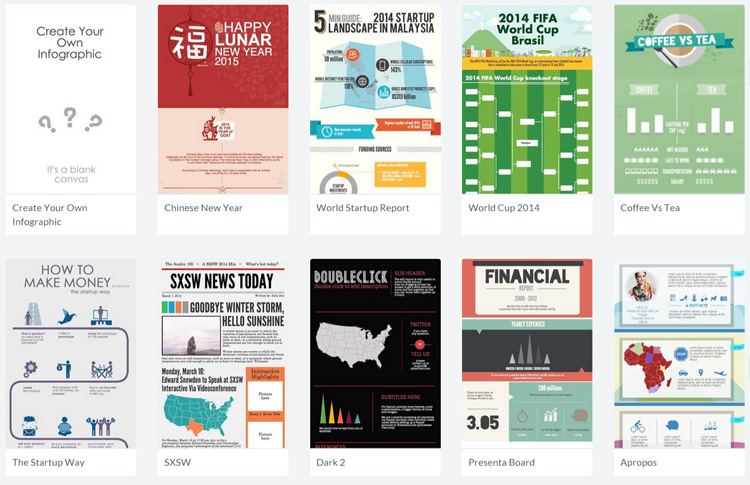
Venngage
Vengage’s user interface isn’t the easiest to use or the most intuitive, but if you’ve got some time to get used to the controls, this is a infographic design tool worth considering.
With the free version of Venngage, you can’t download your design but you also don’t have to deal with too much extraneous branding mucking it up—the page that hosts your design is only lightly branded. You can start with a blank design or customize one of the half-dozen or so included templates. The formatting features are good, with many choices for fonts, colors, icons, and a photo library. Even in the free version the editable charts are excellent, so if you need to include data visualization, this is one of the better choices.
The paid version includes more templates, charts, a library of maps, and the ability to upload your own photos and images, and download your design. However, the free version is so robust that most of the time you probably won’t need it.
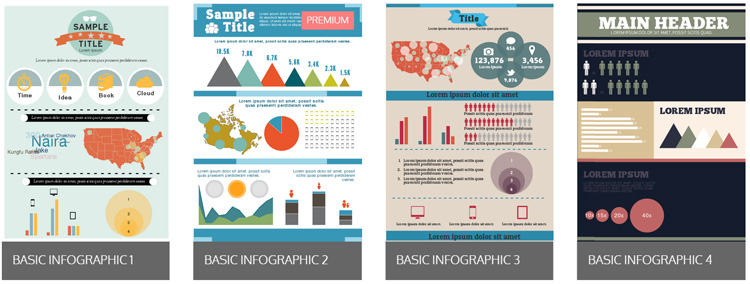
Canva
Canva is primarily a tool for designing graphics perfectly sized for sharing on social media channels (if you need to create social media visuals, Canva is hard to beat). These tend to be simpler designs than infographics, containing a lot less information.
Though it doesn’t currently have infographic templates, Canva has a few ‘Blog Graphics’ templates that are the perfect kick off point for simpler infographic designs.
Canva doesn’t charge a monthly fee for premium features and its free features are substantial, with thousands of shapes, icons, illustrations, and photos. Charts are where Canva falls short. If you need fancy data visualization, you’ll need to upload your chart graphic into Canva or use a different tool entirely.
One of the best advantages of using Canva is that downloading your design—as a PNG and PDF—is free as long as you use only free elements or your own images. If you want to use one of Canva’s premium elements, they’re just $1 each.
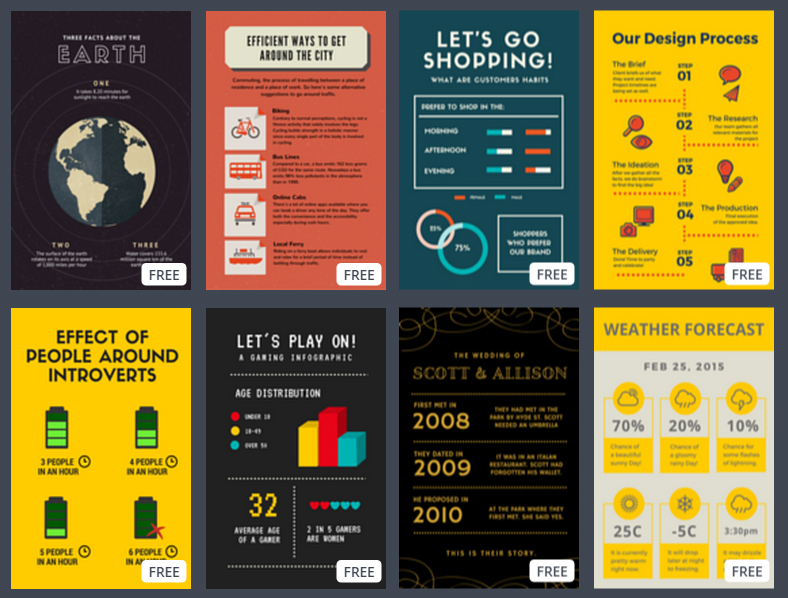
Infogram
If you have a data set that needs some visual oomph, this infographic tool is worth consideration. While Infogram’s data visualization features are excellent, other infographic design functionality is very limited, particularly for free accounts.
With a free account, there are few templates and, compared to other tools, there’s very little that can be customized in these designs. You can’t download the image, though you can embed it or share it on social media, albeit encased in a lot of Infogram-branded advertising. One unique feature is the ability to include multimedia like YouTube and Vimeo videos, Slideshares, and Flickr photos.
Premium accounts are better. These offer downloadable versions of your completed design, a large map library, privacy controls, team collaboration features, infographic analytics, additional formatting options, and more. Some of these are features that a lot of other infographics tools don’t have at all.
One of Infogram’s most intriguing paid features is that you can connect charts to real-time data sources including Google spreadsheets and JSON feeds. That’s feature definitely worth investigating.
These are just some of the available tools for making infographics. What are your other favorites?
Lauren Girardin is a marketing and communications consultant, writer, and trainer. Find her on Twitter at @girardinl.


Thanks for the great ideas Lauren. Readers can also try http://www.easel.ly, which has a free and paid version, numerous templates, and allows you to upload your own photos and logos. I’ve successfully used it a couple of times.
Out of all the above mentioned Tools I like CANVA much more than infogram and Venngage. Because its easy and user friendly and can be easily shareable.Some times it’s difficult to design infographs of our choice in that case you need to go for ready made infographs.Such info graphs can be found at http://graphs.net/.