I get a number of colleagues asking ‘have you got the web stats on our report?’
To which I answer ‘of course I have, if I give them to you what are you going to do with them?’
Naturally I am being slightly flippant.
Google Analytics is great for providing stats on individual outputs and most authors work on one output at a time.
In fact if I see a noticeable tread with a particular report such as Universal credit last week which was a bit of a record breaker – I try to pass the information on to the team and the press office for their information.
However how useful is this information on its own particular when another question is often ‘how does our report compare to others in the same sector or in a different sector?’
My next flippant answer pops out – ‘so if I tell you, will that influence which report you will write next?’ Well of course not.
So this is my digital dilemma – I have some of the data but either it is not in a great format, or it might not tell us very much. What to do?
Well we did spend some time a while ago logging some digital stats against each report. However it was rather time-consuming and I still came back to the same question – what is the point of these stats if we cannot change our behaviour?
However not being easily deterred we have tried a slightly different track after reading various articles about GA custom variables. So my excellent colleague Rob Skilling created a custom variable which in WordPress draws data from existing fields in the database in particular the audit sector of reports such as defence or health.
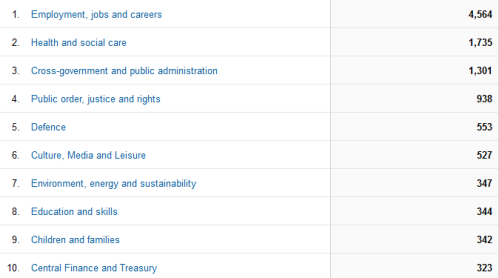
The resulting report looks like this for page visits for the top ten value for money audit sectors in the last two weeks:
So what does this tell us?
Well it shows the relative popularity of the different audit sectors which might have some limited value, but at least it is generated automatically, so no new work to update colleagues if they are really interested in the relative popularity of the sectors.
So what could we do next?
- We could add in the report titles against each sector.
- Following the inspiration of Peter Jordan at GDS we might then create a report for the other content that is more guidance based – then perhaps compare them against each other and see the relative popularity of audit work versus guidance.
- Where the NAO reports against some bigger thematic topics which run across audit sectors we could label the content appropriately and see how popular this thematic content is.
Could be interesting?


Leave a Reply
You must be logged in to post a comment.