The city government of San Diego serves 1.4 million residents by using geographic information systems (GIS) as a core technology. The city adopted GIS 30 years ago, and 2,000 of the 11,500 employees currently working in the city government directly use GIS for data capture, editing and decision-making.
It stands to reason, then, that Jonathan Behnke, San Diego’s Chief Information Officer, added 10 new full-time GIS staff positions to the upcoming budget. Many departments presented increased GIS resources in the city as their number one ask. GIS supports emergency services, community engagement, planning, security, asset management, code compliance and many other services in the city.
Speaking at Esri’s recent Public Sector CIO Summit in Redlands, California, Behnke pointed out that smart cities need regional collaboration. The city and county of San Diego partnered with 19 other regional agencies to share GIS resources. They have a website with 35 GIS layers that can be interactively mapped by the public, with an additional 270 layers available for public download.
Another way to use the valuable GIS data that the city has is through Augmented Reality (AR). A few months ago, San Diego had a city water main break. It was a significant one that flooded the entire street and the area surrounding it. It took two hours to shut it off; part of the delay stemmed from the difficulty of locating the right places to shut off. When staff got to the scene, even though they were equipped with maps to help them locate the pipes and shutoff valves, their true frame of reference, all they could see, was water.
To solve this problem, Behnke worked with Microsoft HoloLens capabilities (augmented reality) and GIS so that if staff members held up tablets to a flooded area, they could actually see the waterline and below the street to where the pipe and nearest shutoff valves were.
Behnke is doing some partner projects and anticipates that there are many potential use cases of this technologies in emergency services. For example, fire departments could use AR to figure out where hazardous substances are located and where the gas shutoffs are located. This could increase operational efficiency and lead to less damage to the people and property involved in the incident.
“We’ll continue to develop AR alongside our other GIS initiatives,” Behnke said.
One of those other initiatives is the Get It Done app, which was released in 2016. Residents use it to report potholes, graffiti and more. The public can use a map to select the location of the problem, and they can also upload pictures. Every city asset is geo-enabled, even trees, so intake staff can point to the problem and figure out exactly where it is on a map. Graffiti pictures are also sent to the police department for investigation. Since the app was released, 65,000 people have downloaded it, for a total of 450,000 submitted reports.
“We’re actually getting calls from regional directors who are interested in an app of their own,” Behnke said. “This was developed internally, and we’re trying to put it out there for other municipalities and even the military.”
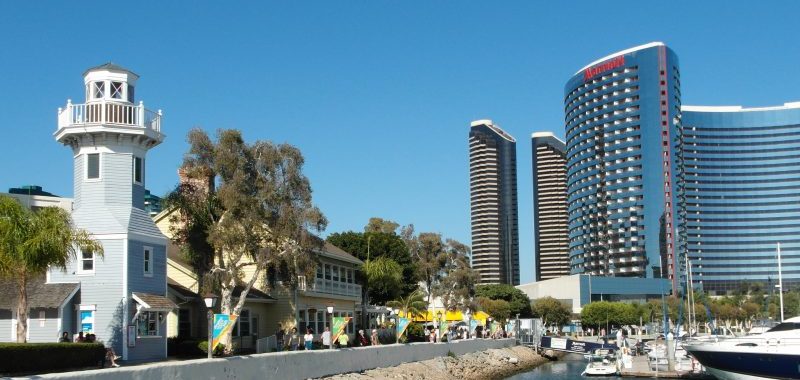
Photo Credit: Brian Kennedy via Flickr.


Great post Sherin! Love hearing about how Smart Cities are using smart tech.