
During my time as a GovLoop fellow, I have written 20 blogs about Esri’s geospatial innovations. And if you ask any of my coworkers they would probably think that number is actually small because of how much of a map nerd I am.
I love to research and write about how maps are used to visualize critical information. However, this 21st blog will sadly be my last – my GovLoop fellowship has come to an end and I’m off to a new gig. But I promise you: I’ll make this post a good one.
One thing I’ve learned here is that when your biggest problem with a platform is that your organization won’t allow you to utilize all of the tech’s features that it has to offer, then you have a good problem. And this is what I heard all around at GovLoop and Esri’s Meet Up on Thursday August 20, 2015.
Every time someone said, “my problem with GIS is…” it usually ended with they couldn’t dive deep enough into ArcGIS or layering because it wasn’t really needed or their IT regulations restricted it. However, the three wonderful speakers at the event, titled Communicating With Maps, were able to exceed expectations even with their so-called “problems” to communicate varying levels of information to the public.
Speaker One: Becca Steele, Digital Media Director, Office of Senator Wyden
When you visit Senator Wyden’s website, the first thing you see is a GIS map visualizing wildfires across Oregon. This is just one of the ways Steele is utilizing Esri products to provide critical information to Wyden’s constituents.
This particular story map illustrates current and past wildfires, how many acres have been burned, what Senator Wyden is doing to combat this, and what funding problems are increasing due to this year’s large extent of fires.
These features are important because the public can understand what their senator is actually doing to remedy these problems in a visually appealing way. Additionally, the story map provides links to more information such as legislation summaries, videos of Senator Wyden on the Senate Floor, and press updates.
A more lighthearted map that Steele created is called Oregon Breweries. The map created using ArcGIS shows over 200 operating or planned breweries across the state.
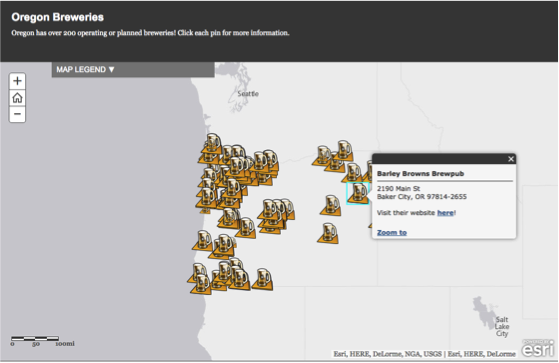
Each beer pin indicates the brewery location and unique information. Not only is this map fun to play with, it also communicates problems small business owners are facing, an issue important to Senator Wyden.
Ultimately, GIS maps have allowed Steele to express policy and state information in an effective, easy to use way. She loves how GIS is usable across all devices and that she can integrate Flickr and excel with just one click.
Now that her entire office is slowly becoming GIS experts as they access the backend to fix or add to maps themselves, she is looking at ways to dive deeper into Esri innovations.
To view all of Senator Wyden’s maps, you can check out their map gallery here!
Speaker Two: Keith Robinson, U.S. Coast Guard Fellow, House Committee on Homeland Security
Robinson’s experience with GIS was little to nothing when he was asked to create a visual component to accompany the Committee’s Blueprint for Southern Border Security.
The blueprint’s strategic vision is to add resources as necessary along the border, taking into account the geography and capability of the region. Through a trial and error process, Robinson was able to create a GIS map using basic ArcGIS Online to illustrate the sector-by sector-approach to border security.
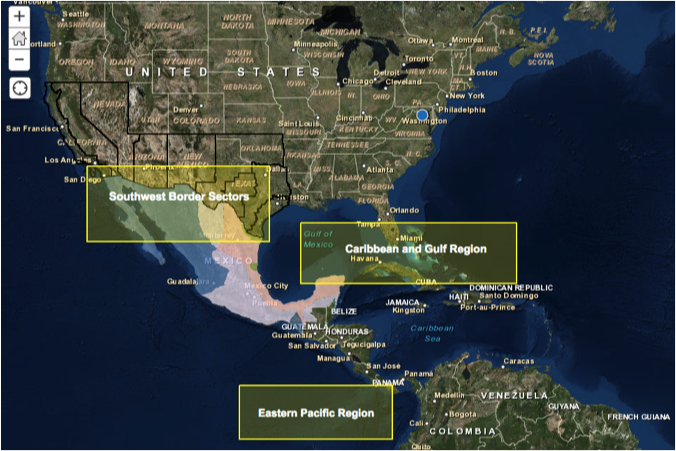
Robinson had to illustrate the specific threats of the region as well as the varying demographics, including large mountainous ranges. What’s more, he faced the challenge of visually exposing drug and smuggling threats along the border while demonstrating the Committee’s strategic vision.
A large barrier for Robinson was the lack of open source data in map forms. As he said, “There was no GIS layer for the Mexican cartels.” With much diligence, he hand drew all of the cartel territories. And if you have as much experience in GIS as I do, you know that is pretty incredible.
The map ultimately allows viewers to actually interact and see the Committee’s strategic vision and where resources need to be allocated. Robinson describes the map as being more about the information and aesthetics but not as much about the actual GIS capabilities. He wishes he had the opportunity to explore more of what Esri has to offer.
To view the map and blueprint click here!
Speaker 3: Bonnie Stayer, Solution Engineer, Esri
Stayer has worked with the Executive Office of the President (EOP) and the Office of the First Lady to build maps that really focus on policy impacts. Examples include a map that illustrates where cuts in education funding are actually going. Distressingly, this map exposes a correlation between budget cuts in low-income areas and increased education funding to more wealthy areas.
To demonstrate the impact of these regulations, the map allows the viewer to click on various districts to see demographic information and what really is happening there. The viewer can also see what the President is doing to reverse this trend.
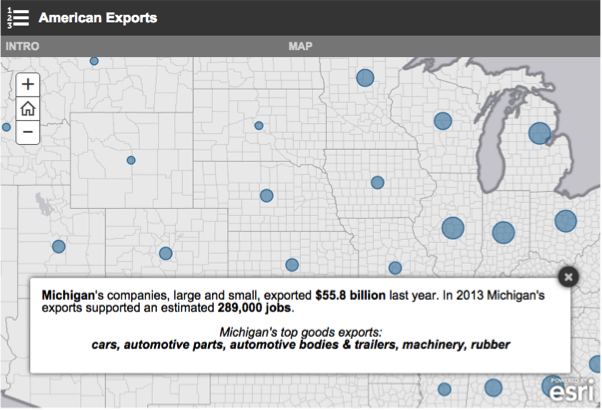
Another map shows the impact of exports throughout each state. The interactive map has larger dots on the states that collect the most amount of revenue from exports. Viewers can then click on those dots to see the actual revenue amount as well as other statistics such as jobs this revenue is supporting.
These maps along with many others are embedded in blog posts to help further explain these policy issues. GIS is vital in allowing EOP to repurpose content to better inform the public.
Esri also built interactive maps to accompany blogs describing the First Lady’s Let’s Move! campaign. The maps illustrate progress across the country as well as where the public can go to participate in various sponsored activities. Additionally, the map allows individuals and organizations to see where they can get involved in the campaign.
As the demand for GIS maps within the White House increase, Esri is able to expand their features on the maps. For example, because they had more time to create the First Lady’s map, they were able to create unique HTML pop ups as well as more customized logos and color schemes.
All in all, GIS is a practical tool that any organization can use to relay information to their audience. From helping mitigate national security to identifying brewery locations, Esri is there to give you more “problems” as you wish to dive deeper into what GIS has to offer.
Well, that is it, my 21st Esri blog as a GovLoop fellow. I hope you learned a little something and are inspired to go make a map!
Look out for registration information for the next Esri and GovLoop meetup.


Leave a Reply
You must be logged in to post a comment.