

In Kansas, a state facing patterns of opioid misuse, state and community organizations are saving lives. Much of their work involves collaboration around smart maps — maps that layer key data to show where overdose deaths occur and reveal insights about how to prevent them.
Connecting the dots between location and prevention is a key concern for public health analysts like DJ Gering, who works in the Kansas chapter of the federal Overdose Response Strategy (ORS) program.
The Kansas ORS uses their geographic information system (GIS) to create these smart maps. “GIS technology allows us to provide location-based solutions to communities being affected by substance misuse and even set up prevention methods in communities that are at risk,” Gering said.
Relying on Real-Time Data
The Kansas maps show real-time information from the federal Overdose Detection Mapping Application Program (ODMAP). By adding ODMAP data into their ArcGIS Community Analyst web app, ORS staff can view key data — building information, social determinants of health, risk factors, and demographics — in the context of location for a more focused response. For example, they now pinpoint distribution of naloxone, a drug that can reverse opioid overdoses.
Previously, overdose data might have appeared as giant clusters on a street map. But GIS maps contain detailed building information and heat map capabilities that allow ORS to identify specific apartments, hotels, and gas stations where overdoses occur most frequently.
“The overdose heat maps provided by the ORS team supported Safe Streets Wichita’s targeted approach for distributing naloxone,” said Ngoc Vuong, a community mobilizer for Safe Streets Wichita. “The data also allowed us to reach out to the Wichita police department, who have established relationships with lodging facilities, and partner with them to equip those facilities with naloxone.”
Insights for Community Intervention
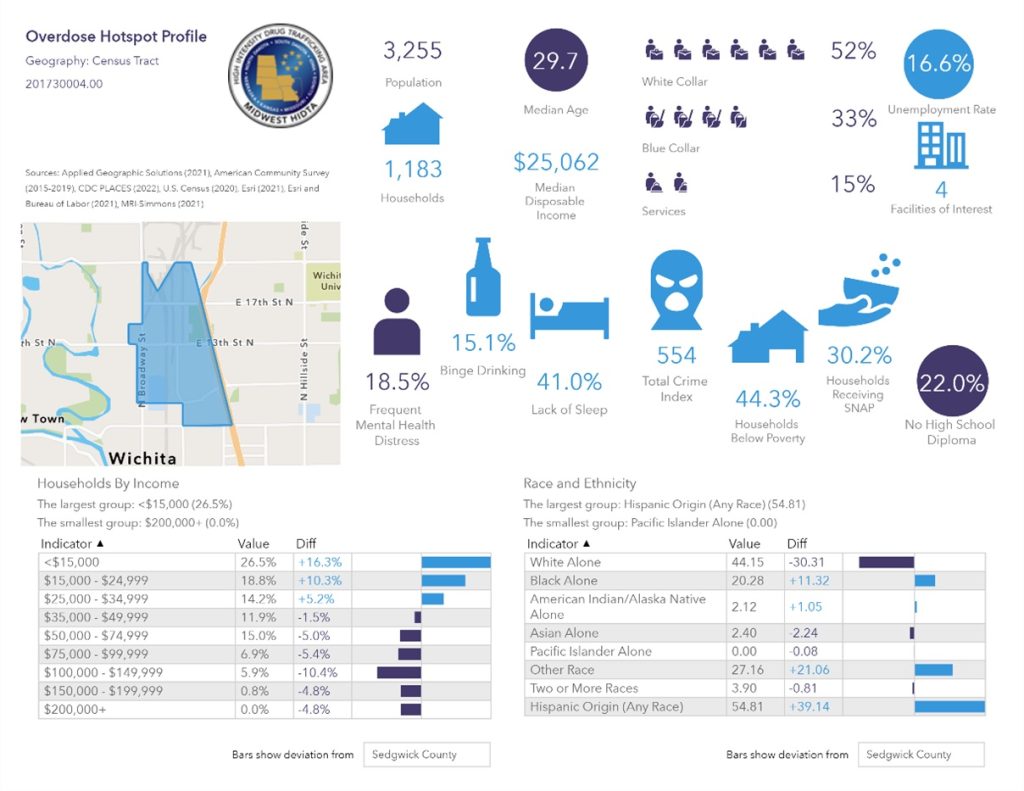
To address the root causes of substance misuse, ORS brings together data around social factors and demographics from public health and public safety sources. They have created a profile for each overdose hotspot on the map. Staff can click to reveal information like household income, education levels, race and ethnicity, crime statistics and mental health data.
Such insights help community groups better respond to specific needs, cultural factors, and language preferences for each location. Spanish-speaking groups have centered on areas with predominantly Hispanic populations. In areas with a high number of reported adverse childhood experiences — a common risk factor for substance misuse — mentoring groups have increased their presence in schools.
“Our leadership and board of directors are grateful for the eye-opening data the ORS put together, and it has helped inform how we will focus our strategies to help break cycles through our one-to-one mentorship, as well as identify future partnerships to combat the significant challenges our community is facing,” said Mary Shannon, CEO of Kansas Big Brothers Big Sisters.
Maps Inspire Infographics
ORS staff even utilized ArcGIS Community Analyst to create location-specific infographics for a recent Kansas Prevention Advocacy Day.
“The infographics created by the ORS provide community members focused on substance misuse prevention with sophisticated data, equipping them for more current and specific conversations with their elected officials about the needs in their communities,” said Chad Childs, prevention initiatives manager with Wichita State University’s Community Engagement Institute, a sponsoring partner of the event.
Christopher Thomas is the director of government markets at Esri and a founding team member of the Industry Marketing Department. Prior to joining Esri in 1997, he was the first GIS coordinator for the City of Ontario, California. Thomas frequently writes articles on the use of GIS by government.
Learn more about how GIS addresses substance misuse.


Leave a Reply
You must be logged in to post a comment.