
For the past month, New York’s civic hackers visited PLUTO.
We are not talking about the “formerly” ninth planet, we are talking one of the most important datasets any city could provide as open data — tax lot and zoning data compiled into one massive map. In New York City, this data is known as PLUTO — Primary Land Use Tax Lot Output. In addition to PLUTO, New York City’s Department of City Planning’s data portal – BYTES of the BIG APPLE — contains several rich datasets integral for understanding the city. For a collection of dense islands and the Bronx, untold wealth hides in these ones and zeros.
Up until last month and despite Local Law 11 of 2012, PLUTO and MapPLUTO were under a restrictive license and cost $300 per borough. Though the collective effort of the New York City Transparency Working Group, New York City’s Mayor’s Analytics Unit, the Department of Information Technology and Telecommunications, and the Department of City Planning, on July 25 2013, MapPLUTO was freed.
For some, like Steven Romalewski, the director of CUNY Mapping Service at the Graduate Center of the City University of New York (CUNY), this day has been nearly 20 years in the making.
The value of PLUTO is just beginning to be explored.
Though the efforts of 596 Acres, and CUNY’s OASIS map, the community had been introduced to the value of PLUTO’s data. After the liberation, BetaNYC hosted three “get to know” PLUTO nights. In our first night, Jessie Braden, Pratt Center for Community Development, and Steven Romalewski, gave a two and half hour long presentation on the history, power, and richness of the PLUTO dataset. (PowerPoint Slides | Google Slides)
On BetaNYC’s second night, civic hackers, yackers, and mappers, gathered to discuss potential projects and problems.
One particular problem arose, what about PLUTO’s historical data? PLUTO, like the city, has developed. As New York City grows, as buildings go up and come down, as land use evolves and we gain and lose parts of the city to the sea, these changes are reflected in the collection of datasets that is PLUTO. As the city, is rezoned, remapped, reparsled, and reaches new heights, PLUTO plotted these changes. Now, we want to expose all of these changes and study them. Since, PLUTO’s previous releases had been under a restrictive license, are we free to liberate them? How do we get access to this historical data?
Additionally, we questioned how will we modernize and adapt the City’s Zoning and Building Code into 21st century interfaces? This is a similar conversation Carl Malamud is fighting on a national basis.
Then, two important events happened last week.
First, StreetEasy, our “Get to know PLUTO” and hacknight host and one of New York City’s best known Real Estate startups, was acquired for $50 million. Why so much? SteetEasy is “bringing a new level of transparency to the traditionally secretive, clubby world of Manhattan real estate…”
What is at the core of StreetEasy’s data? PLUTO.
Second, We concluded our tour of PLUTO month at Harvest, a great NYC tech company and premier time tracking application. For our first PLUTO demo night, also sponsored by CartoDB, we covered eight demos featuring PLUTO data.
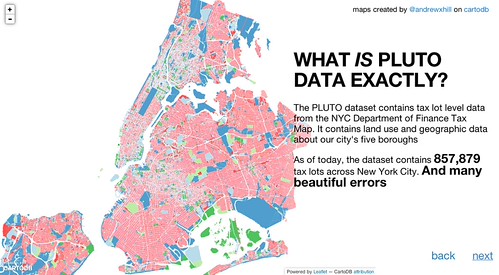
Andrew Hill presented his excellent PLUTO Data Tour, built on CartoDB.
Steve Romalewski presented his OASIS map and the power of historical data located within.
Chris Whong walked us through PLUTO’s Floor Area Ratio as a Cartogram. He discovered that you would need an island 10 times the size of Manhattan if the city was flattened to one story tall.
Frank Hebbert, from OpenPlans, built a tool to help Community Boards asses liquor licensing discussions.
Ontodia highlighted the fact that PLUTO data is built into their NYCpedia wiki. This wiki increases the usability of New York City’s open data into a usable and readable format.
Exversion, which publicly launched on our first night, demoed how you can access PLUTO data via their universal API and how to version data. Note, this is a super cool data tool!
Columbia University’s Modi Research Group demoed their New York City energy map and a bunch of tools.
Energy Zip demoed a map that started during NYC BigApps and has since been improved a number of times at other hack-a-things. Like Modi’s map, Energy Zip allows you to zoom into New York City’s energy data and see our energy habits.
Questions? Comments? Hit us up @codeforamerica.
Leave a Reply
You must be logged in to post a comment.