
Despite all the talk of integrated talent management and people management being the hub of engagement, empowerment and the overall organizational environment, we still seem to get bogged down in thinking about key elements of talent management in various HR silos.
However, so much is tied together. If you could just open up the treasure trove of data and have it magically unscrambled, you could see that the dots are connected. And from there, answers to so many questions could unfold; in fact, insight would come from issues you might not even know exist.
We live in a visual world, and certainly images, properly created and conveyed, can simplify the complex. Often, the more data we have, the harder it can be to understand and make any sense of it. At the same time, challenging problems are sometimes overthought.
This is where the simplicity of a picture or graphical image can help.
Here’s an example. You may have a wealth of employee performance management data. On its own, it certainly provides insight into some of your employee issues, including high performers, underperformers, goals and achievements. Typically this is at an individual or perhaps team level. This information is still interesting, yet still not incredibly insightful.
Now take employee engagement data, if you are fortunate and forward thinking enough to have such data. Again, this can be very useful information and provide insight into individuals, teams and managers. We know how crucial engagement is, so any related data can be powerful.
Tie performance and engagement analytics together and you can tell a much more powerful story, gain significantly more insight, answer numerous questions and address organizational challenges and obstacles.
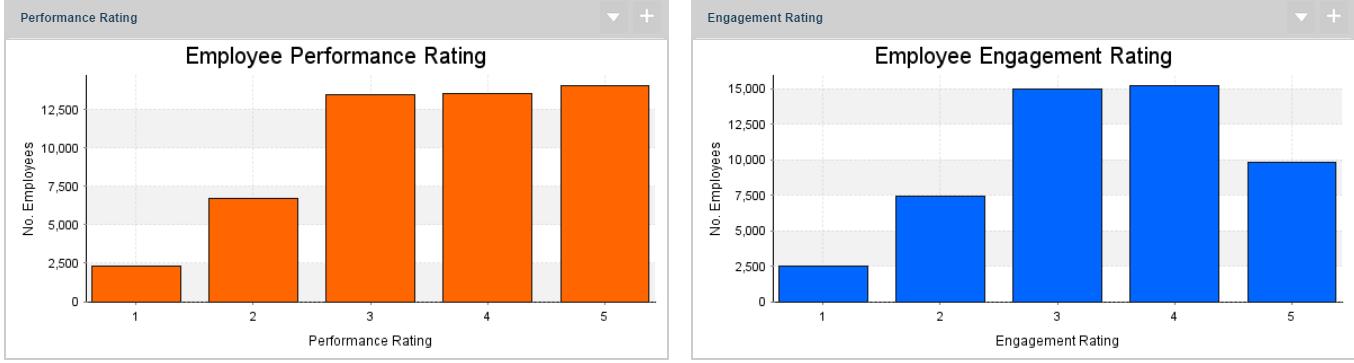
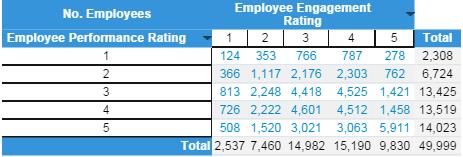
In this set of graphs, we can see, side by side, a hypothetical organization’s employee performance and engagement information together in easy-to-read graphs. We can quickly see total employee numbers in terms of rankings and levels of engagement. What are the levels of top performers and under performers? How well is overall employee engagement? You can see trends between high performance and levels of engagement, and low performance and levels of engagement.
From here, you can drill down and see trends and common traits among high performers and low performers. Is the level of employee an indicator? Do particular teams or managers have common performance rankings or engagement ratings? Can you spot people that appear ready to be promoted? Or ready to quit?
Separately, data can provide much insight to our talent management challenges and problems. Together, even more insight can be gleaned.
With images, even more insight can be achieved – more quickly and with more detail, if desired.
A powerful, intelligent story.


Leave a Reply
You must be logged in to post a comment.