

Tacoma, Washington, like other US cities had concerns with a history of racial discrimination and inequitable investments, is intentionally reversing that legacy. Over the last nine years, city leaders have passed a Vision 2025 plan and introduced an Equity Index map to guide decisions on everything from small business loans to utility upgrades. The city’s 219,000 residents, an ethnically diverse population, are seeing the impact.
When city officials were planning to distribute grants worth up to $15,000 each to local businesses, staff used the Equity Index to target efforts resulting in a 333% increase in dollars awarded to Black-owned businesses in 2021. Of more than $3.4 million awarded, 56% went to BIPOC-owned businesses. It’s also become standard practice for the city to use the Equity Index in awarding microloans of up to $25,000 to microenterprises, minority-owned companies, and women-owned companies.
Powering Tacoma’s Equity Index is geographic information system (GIS) technology. The interactive mapping and data management tool supports work across city departments and agencies. It’s relied upon for equity-based decisions related to asset management, budget proposals, new policies, department goals, and racial equity action plans.
“We need[ed] a visualization, we need[ed] a map that speaks to the people, that recognizes their lived experiences and can help us guide these types of decisions,” said Daniel Key, the IT director for the City of Tacoma.
The results stretch beyond local businesses to decisions made about housing and essential services.
- Tacoma’s planning department used the Equity Index map to show how historic housing policies were negatively impacting people of color. When officials saw the data visualized on a map, they could determine where to prioritize development of more affordable housing.
- Tacoma Public Utilities used the Equity Index to upgrade 290,000 water and power meters. By using the map, staff could see neighborhoods that hadn’t had infrastructure investments previously and prioritize those places for improvements. As of January 2023, nearly all the areas had been upgraded.
Being Intentional About Overcoming Exclusionary Policies
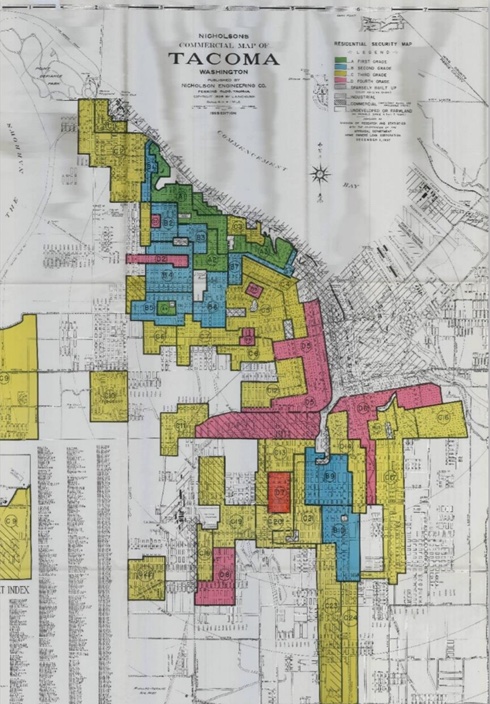
The work really started when city leaders acknowledged how Tacoma’s history had influenced its policies. Early settlers displaced Puyallup tribe members from their land. Chinese residents were forced out in 1885. Japanese residents were imprisoned during WWII. Racial segregation was widely practiced as redlining through the 1960s.
City leaders wanted to create an intentional tool and framework that supported inclusive change.
Staff at the City of Tacoma’s Office of Human Rights worked with Ohio State University’s Kirwan Institute to develop an index with three goals: identify racial disparities, increase transparency and accountability, and support data-driven decision making at all levels.
The resulting Equity Index scores 153 census block groups in Tacoma by 32 different indicators sorted into five categories — accessibility, livability, education, economy, and environmental health — to visually show the disparities in residents’ access to services and opportunities.
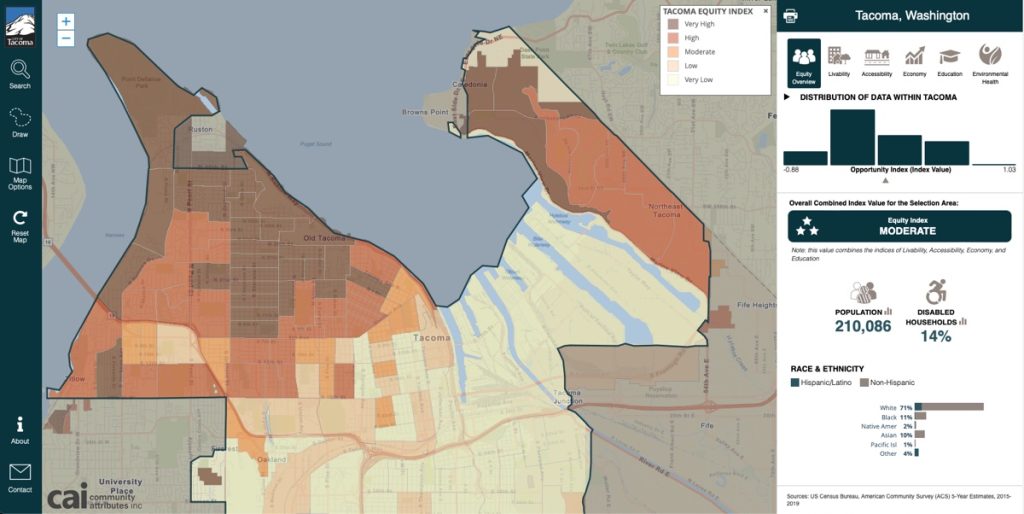
The data is also presented in a way that avoids traditional stereotyping; for instance, instead of the typical green used to indicate wealthier communities, dark shades of red highlight areas that have experienced high investment. Gradient grays represent areas where more investment and opportunity are still needed.
“You need to know the story you want to tell and use data and tools to amplify that impact,” Key said.
City officials have plans for future applications of the smart map and are sharing their best practices with their partners in Pierce County to work together toward a shared vision of equity for future generations.
Watch the City of Tacoma’s presentation on creating their Equity Index at the 2023 Esri CIO Summit, and learn more about how the city addresses affordable housing and inequities.
Christopher Thomas is the director of government markets at Esri and a founding team member of the Industry Marketing Department. Prior to joining Esri in 1997, he was the first GIS coordinator for the City of Ontario, California. Thomas frequently writes articles on the use of GIS by government.


Leave a Reply
You must be logged in to post a comment.