
![]()
Last week I introduced the conceptual underpinning of a new paradigm for federal IT progress designed to reestablish public trust and confidence lost through dozens of serial failures. I identified the four envelopes that need to be pushed: program and project management, architectural modeling, user experience modeling, and collaborative development. This week we’ll look at the program and project management envelope in more detail by first examining what’s currently available to public stakeholders then how we could make all our IT programs and projects more transparent.
Federal IT Dashboard
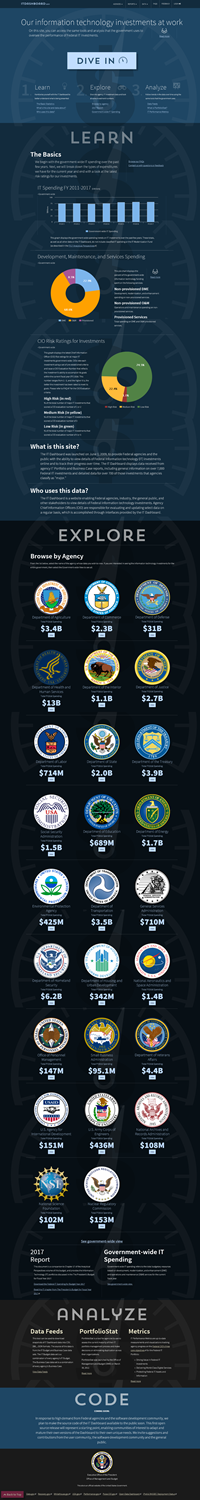
Before describing where this envelope needs to be pushed, let’s take a closer look at the existing envelope: the federal IT dashboard. The scrolling screen capture shown to the right is a vast improvement from the original dashboard launched in 2009. Summary information is shown on the major investments, broken down by department (or agency), by type, and CIOs’ risk ratings. A relatively new feature is the ability to pull data directly from the dashboard in a variety of formats. The URL for direct downloads can be generated by utilities found on the site and the data can be delivered in either CSV, XML, or JSON. Hopefully, these improvements were the result of both public feedback and very specific criticism delivered by the Project Management Institute directly to the OMB E-Gov office through a meeting of their executives, industry representatives, and federal practitioners (the author being one of the later) with senior policy officials.
With all of the top-level information on federal IT investments available for over 7,000 projects, of which 700 are considered “major,” why does this envelope need to be pushed? There are several reasons that are not immediately apparent to the citizen stakeholder:
- Insufficient detail,
- Rear-view presentation,
- One-way communication, and most damming
- Alternate universe accuracy.
Let’s take those one-by-one.
Insufficient Detail
There is a very high level of abstraction with all of the projects: you can get an idea of the major project metrics, cost, schedule, and risk, but scratching beneath that level of summary is impossible. Worse, only the current metrics are available without resorting to digging through data on your own – there simply isn’t any trending information and no “stoplight” indicators that look at those trends. This lack of detail means you’ll be able to see where there’s variance today, but you can’t start with the investments that are in trending trouble first.
For the casual user of the IT dashboard, the recent improvements may be enough to satisfy curiosity. But for the IT executive or project management professional, the level of detail is simply insufficient, even when the data extract view is taken. Work breakdown structures are, at best, only one level deep and at that, there really isn’t any indication of dependency, sequence, or current status.
Another casualty of the current dashboard is the absence of earned value metrics. Most of the investments tracked on the IT dashboard are subject to EVM reporting requirements, yet none of that data is available, even through direct download. The absence of EVM data and the trending of such data over time denies the public a view of which investments are actually returning value for investment – which are still paying off and which never have (and presumptively never will). These have important portfolio management implications, but are invisible in the current dashboard.
Take just one project as an example: Health and Human Services Department, CMS Healthcare Fraud Prevention Partnership (HFPP). You can view the project summary on the IT dashboard at https://itdashboard.gov/drupal/summary/009/1630#. Just the FY16 spend is $13.6 million, with total lifecycle costs over $48 million. Yet, looking at the Business Case for this project, we see that EVM is excused from this project because it’s not required for projects with lifecycle costs below $10 million (see page 6 of 11 on the PDF, Section D, Q&A #2). And keep in mind this business case was last updated on April 27, 2016. What am I missing here?… Worse, how many more excuses for not using EVM on projects admittedly more than the investment threshold triggering EVM use are there buried in the IT dashboard business cases (of the 7,000 already there)?
Rear-view Presentation
As mentioned in the detail insufficiency discussion, the lack of trending information coupled with the reporting requirements through which the IT dashboard is updated result in a decidedly rear-view perspective: we’re only driving looking backward through a fuzzy mirror. Worse, we’re likely simply being taken for a ride, seated in the rearward-facing back seat.
So what don’t we know (besides the trending information that would, at least, let us keep an eye on potentially problematic issues)? As already mentioned, we don’t have any trending information on investment value or the trend in such returns. We don’t know what major (or minor) milestones are lurking ahead that could make even the rear-view perspective irrelevant (e.g., the healthcare.gov site pre-launch milestone and testing events). It’s hard not to run into walls when you only have a view back in time and no indication where a project is headed or where the rest stops are ahead!
One-way Communication
Nothing about the current IT dashboard suggests anything but one-way communication of even meager project content: there is no feedback mechanism or contact information for the dashboard in general or projects/investments in particular. Indeed, the XML updating process that flows project data through the federal MAX system to reach and get aggregated for the IT dashboard strips out the submission of those responsible for reporting such information: anonymity on purpose.
I fail to see the point of what little transparency is presented through the existing IT dashboard if there is no potentially actionable recourse. Essentially, the message delivered is: this is the way it is (except for what we don’t want you to know) and we don’t care to hear back from you taxpayer sponsor-stakeholders, thank you very much!
Alternate Universe Accuracy
From the perspective of Project Management Information Systems (PMIS) design, the existing federal IT dashboard presents the portfolio investments in what can only be described as alternate universe accuracy: there is no “ground truth” being reported from actual project, program, and portfolio planning and execution systems directly to the federal IT dashboard. What looks like authoritative project information is, in most cases, actually manually or independently crafted XML feeds routed through MAX and aggregated behind the IT dashboard system. This non-integrated approach introduces not only massive opportunities for inaccuracy, but for intentional “alternate universe” representation of actual project ground truth.
In a risk-averse organization as large as the federal bureaucracy, the opportunity (and pressure) to shade or spin project ground truth to present a more favorable dashboard presentation can be enormous. Do you really think all the ground-truth project indicators for healthcare.gov were “green” right up to the day the site failed in front of the entire planet? Really? Really!
The Way Forward – Pushing the Envelope
Next week I’ll present a view of what the federal IT dashboard can become, how it can facilitate citizen-stakeholder engagement and participation while satisfying oversight needs to a degree and depth not now possible.
Richard L. Warren is part of the GovLoop Featured Blogger program, where we feature blog posts by government voices from all across the country (and world!). To see more Featured Blogger posts, click here.


Thanks for breaking down the project management envelopes like this! Very good read!
Thanks, Katrina. I’ve been agitating for better federal program and project management for several years now but lack of executive sponsorship within the OMB E-Gov office has really hampered any progress being made. And I can’t honestly say it’s because they’re disinterested – they’re just so busy putting out fires they can’t focus on preventing them! Lots more on that problem in Part 2, in review now and (hopefully) published tomorrow…;-)