
It’s your weekly dose of TSP Talk.
Stocks were mixed again on Friday, as the Dow and S&P 500 closed modestly lower, while the small caps did well, and the I-fund managed a small gain. Bonds were also up slightly.
We started last week with a sharp decline, believing we could be seeing the start of the next intermediate-term move. But by the end of the week most indices gained most or all of their earlier declines, and we were left with the same question; which way is this market going to break from this recent trading range?
The S&P is back above the 20 and 50-day EMA’s, and above the 200-day simple moving average (not shown but it is 894), but is remains below the 200-day EMA. It is a tight bunch of moving averages and trendlines and we are due for a sharp move, unfortunately, I have to claim ignorance on knowing which direction that may be. But now that we are hitting the summer doldrums, who knows how long this choppiness will last?

Chart provided courtesy of www.decisionpoint.com, analysis by TSP Talk
If the market wants to break to the upside, breaking through resistance after a long consolidation, I feel that I should not fight it and start looking for an entry point. If, however, the market breaks down, it becomes a waiting game again, as we wait for the long bear market to run its course.
The NYSE overbought/oversold indicator was pushing into oversold territory after last Monday’s sell-off, although it was not an extreme reading. The market was able to rebound off of that oversold level and is now back into slightly overbought territory.

Chart provided courtesy of www.decisionpoint.com, analysis by TSP Talk
The trend of the indicator seems to have turned down, which means we could see a series of lower overbought highs, and lower oversold lows.
Last week’s TSP Talk Sentiment Survey came in at 36% bulls, 54% bears, for a 0.67. to 1 bulls to bears ratio. This is a little short of our 0.49 to 1 ratio needed to give us a buy signal, so the system remains on the sell signal for this week.
Our survey is taken on Thursdays, and we saw a big rally last Thursday. For that reason our bullish percentage of 36% was higher than the AAII’s survey’s 28%, which was taken on Wednesday, although our survey had a higher percentage of bears (54% vs. the AAII 49%). Only 10% of our those who took our survey were neutral, where the AAII had about 22%.

Chart provided courtesy of www.decisionpoint.com, analysis by TSP Talk
Not surprisingly, our friends at SentimenTrader.com were able to dissect the prior occurrences where the bullish percentage dropped to a 3-month low while the S&P 500 was rallying the way way it has…
“Let’s try to find any time since the survey’s inception in the late 1980’s when the percentage of bulls dropped to a three-month low, but the S&P 500 had rallied at least 12% over those three months.
Uhh, we can’t. It’s never happened.
How about after a 10% rally? Then we get only two precedents (using Friday-to-Friday closing prices). Those priors occurred on 04/26/91 and 03/07/97. Over the following month, the S&P lost -0.4% and -5.9%, respectively.
To get more instances, let’s drop the requirement to a three-month rally of 5% or more in the S&P. In that case, 26 weeks qualify for the study. And one month later, the S&P was positive 54% of the time with an average return of +0.5%, and an average drawdown (maximum loss) that almost exactly equaled the average maximum gain, around 2.1%. That’s not horrible, but it’s certainly not the major buy signal that “wall of worry” proponents would probably suggest.
Over the past decade, we’ve seen this happen 11 times. During the next month, the S&P managed to rally only 3 times, and its average return was -1.5%. Lest you think this was purely confined to the bear markets, the last occurrence was on 08/05/05, fully in the midst of the last great bull run. Over the next three months, the S&P lost close to -4%.
The time before that was 12/31/04, right before the S&P took another multi-month tumble. The time before that was 01/30/04, after which the S&P topped out a few weeks later and tripped into May.
During the last bear market, we saw this occur on 06/08/01 and 01/11/02. The S&P lost more than -4% over the next month both times.”
— Jason Goepfert
www.sentimentrader.com
So, while we are seeing some overly bearish readings, if we are still in the long-term bear market, these are not quite extreme readings.
Here is the seasonality chart for July . Looks like early and late July tend to do much better historically than the middle of the month. Last year the C and S funds dropped 0.80% in July, while the I-fund lost 3.7%. Bonds were flat.
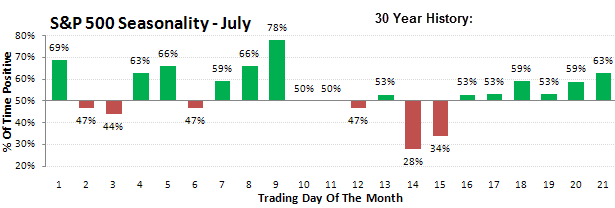
Chart provided courtesy of www.sentimentrader.com
That’s all for today. Thanks for reading. This market commentary is updated daily on www.tsptalk.com.
Tom Crowley
TSP Talk


Leave a Reply
You must be logged in to post a comment.