
This blog post is an excerpt from GovLoop’s recent guide Embracing Data Analytics: Common Challenges & How to Overcome Them. Download the full guide here.
Sometimes the most challenging part of diving into a new project is figuring out where to start. What resources do you need? Who should be involved? What is the end goal, and how do you get there?
For a number of agencies, data analytics projects are no different. Although they’re not an entirely new undertaking in government, many program offices, sub-agencies and even larger departments are still working through strategies to fully embrace analytics.
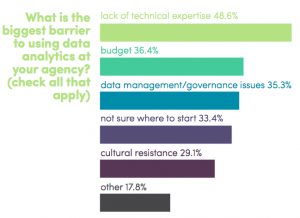
For more than a third of our survey respondents, uncertainty about where to start is their biggest barrier to using analytics. If you’re in a similar boat, this section will help you navigate some of the fears and challenges that come with new beginnings.
To get practical insights on where to start, we spoke with Anthony Fung, Virginia’s Deputy Secretary of Technology, and Ron Guggisberg, Fire Captain of EMS at the Fargo Fire Department in North Dakota.
In Virginia, data analytics isn’t a new concept. The commonwealth has several projects under way, including one to analyze workforce and education data. But even the most advanced government organizations have to ensure their efforts align with basic principles for success. We’ve adapted a few of them from our interview with Fung about the use of shared data and analytics:
Identify key projects that provide the highest likelihood of realizing the value of data and analytics in new ways. In Virginia, the governor is looking for projects that demonstrate cost savings and draw on resources statewide. Consider your agency’s mission and priorities, and align analytics projects with those efforts.
Maybe you don’t have a chief data scientist to help you chart this course, but there are often people within the agency — or a sister agency — who have a knack for data projects. Seek them out, and get them involved.
If you haven’t already, now is the time to start a dialogue among the groups that have a hand or a say in how your organization uses data. Think through data sharing, governance and ethical use issues. Conduct a comprehensive review of all legal, privacy and governance concerns as they relate to data sharing at your agency.
If procuring analytics tools is your challenge, take some cues from the commonwealth. Fung said the state created a procurement vehicle to provide next-generation analytics products and services, and one of the requirements for awardees was to provide analytics pilots on a limited scale for agencies at no cost to the state. Also consider the state’s universities for capabilities and resources. Many of them are investing in talent and infrastructure that could support state efforts.
Partner with the civic community and nonprofit organizations as you embark on analytics projects. One way is by making datasets available to people beyond the walls of your agency who can turn data into actionable insights using visualizations and other tools. “There are a lot of people with passion and citizens who are really engaged and ready to be part of the solution,” Fung said. If you need some inspiration, check out this recent datathon that Virginia hosted.
Maybe your agency is in the early stages of launching a data analytics project and not quite ready for prime time, or maybe you’re on a solo journey to win the hearts and minds of skeptics who are not on board with analytics. Here are some things to keep in mind:
Don’t despise humble beginnings. Guggisberg knows the realities of tight budgets. There is no innovation budget to fund above and beyond what are deemed the essentials for fire and rescue. For the time being, he is testing a commonly used visualization software that doesn’t require an extensive tech background.
Consider fellowship and grant programs. To help fund long-term use of the software and other tools, Guggisberg is applying for grants and fellowships. One in particular is What Works Cities, a national initiative Bloomberg Philanthropies launched in 2015 to help midsize U.S. cities enhance their use of data and evidence to improve services, inform local decision-making and engage residents.
Show and tell. Don’t keep all the work and results to yourself. Guggisberg uses the software to create dashboards that he shares with the fire crew, mainly the chief. For example, firefighters recently started carrying Narcan, a prescription medicine that blocks the effects of opioids and reverses the effects of an overdose. “I went back to 2011 and pulled all of our runs, searched for the word overdose, and was able to put it in a map with a time of day, so we could see where it’s occurring and what time of day it’s occurring,” he said. “It’s just sitting on a hard drive,” Guggisberg said of the data. For now, he hands out dashboards in PDF documents, and “the hope is that someday somebody starts requesting more of it.”
Tell a story with the data. Response time analysis is a big deal for the fire department. Using the visualization software, Guggisberg can create a visual story that shows when a call came in, how long it took to respond and what variables impacted response, such as traffic or the number of functioning trucks. When these pieces of data are brought together they provide a complete picture. For example, knowing that response times are affected when a truck is out of service is one thing. But putting that data on a graph so that people can visualize the impact makes a difference.


Leave a Reply
You must be logged in to post a comment.