
Infographic: Recent App Survey of Fifteen Thousand Users Shows How Citizens Connect To Police
As the police and the public continue to connect with technology, there is a growing demand for information. I thought it might be time to share some stats and decided to have an infographic created with our My Police Department (MyPD) app stats. We thought it would be interesting to display our police app information in a visual format.
The My Police Department App recently reached over 200 partner agencies! We have had increased inquiries from citizens and agencies over the past few months. Since My Police Department (MyPD) is utilized as an official police app for partner agencies, it is necessary to compare it to similar apps that are generally developed per agency. Other apps that are not official or safety type apps don’t really fit into the official government app category. There are various apps out there used by different police departments and law enforcement agencies. Since it is difficult (or near impossible) to determine the details and statistics of their use we decided to use our own data.
Our data continues to increase as the app grows. When I refer to “our data” I mean the app in general, however “our” is a combination of our partner public safety agencies combined, considering the app exists to serve their agencies and communities and everyone shares one platform. There are several great benefits to this approach. The app is truly distinct to each agency as each can manage their particular app features, data, and more.
We have many partner agencies of various sizes with a good amount of users who have provided us with important data. Many of those users contributed to this infographic, and while we don’t know who they are, MyPD and official partner agencies are pleased that they are connecting with their local police! For the app user data in this infographic we took the most recent data from about 15k user responses over the past couple of months. Some users choose to skip the questions but a good amount do choose to share some anonymous data.
With the recent launch of MyPD version 3, we began asking app users questions about who they were and how they found their police department’s app. This data is sent to the agency dashboard for review and allows a police department to better understand their app users and graph their usage over time. Users have the option to skip the questions but many choose to answer them. For example, we can gather anonymous data about the users age range, how they learned about the app, etc. and send that information to the agency for analysis.
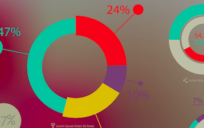
Here are three interesting statistics from the infographic:
- The smallest law enforcement agency using the app serves a population of around 1k people.
- Approximately 13 million push messages were sent to users from all agencies in the past year.
- The second most popular way users found the app was from the agency website.
The infographic data that we have is still in its infancy. While the app has been around for a few years we only recently began to collect certain information. Many police departments also either recently launched or will be launching soon. There are also police departments of various sizes and populations. We hope to continue sharing unique app infographics with you over the coming months and years. Individual agencies may choose to share their data once they start to develop more information and responses from users.
In future posts I hope to share some more data and best practices from our law enforcement partners.
My creative designer Dylan made the following police app infographic. We hope you like it, if you do, please share it! (click here for a larger version)

Embedded from WiredBlue


Leave a Reply
You must be logged in to post a comment.