
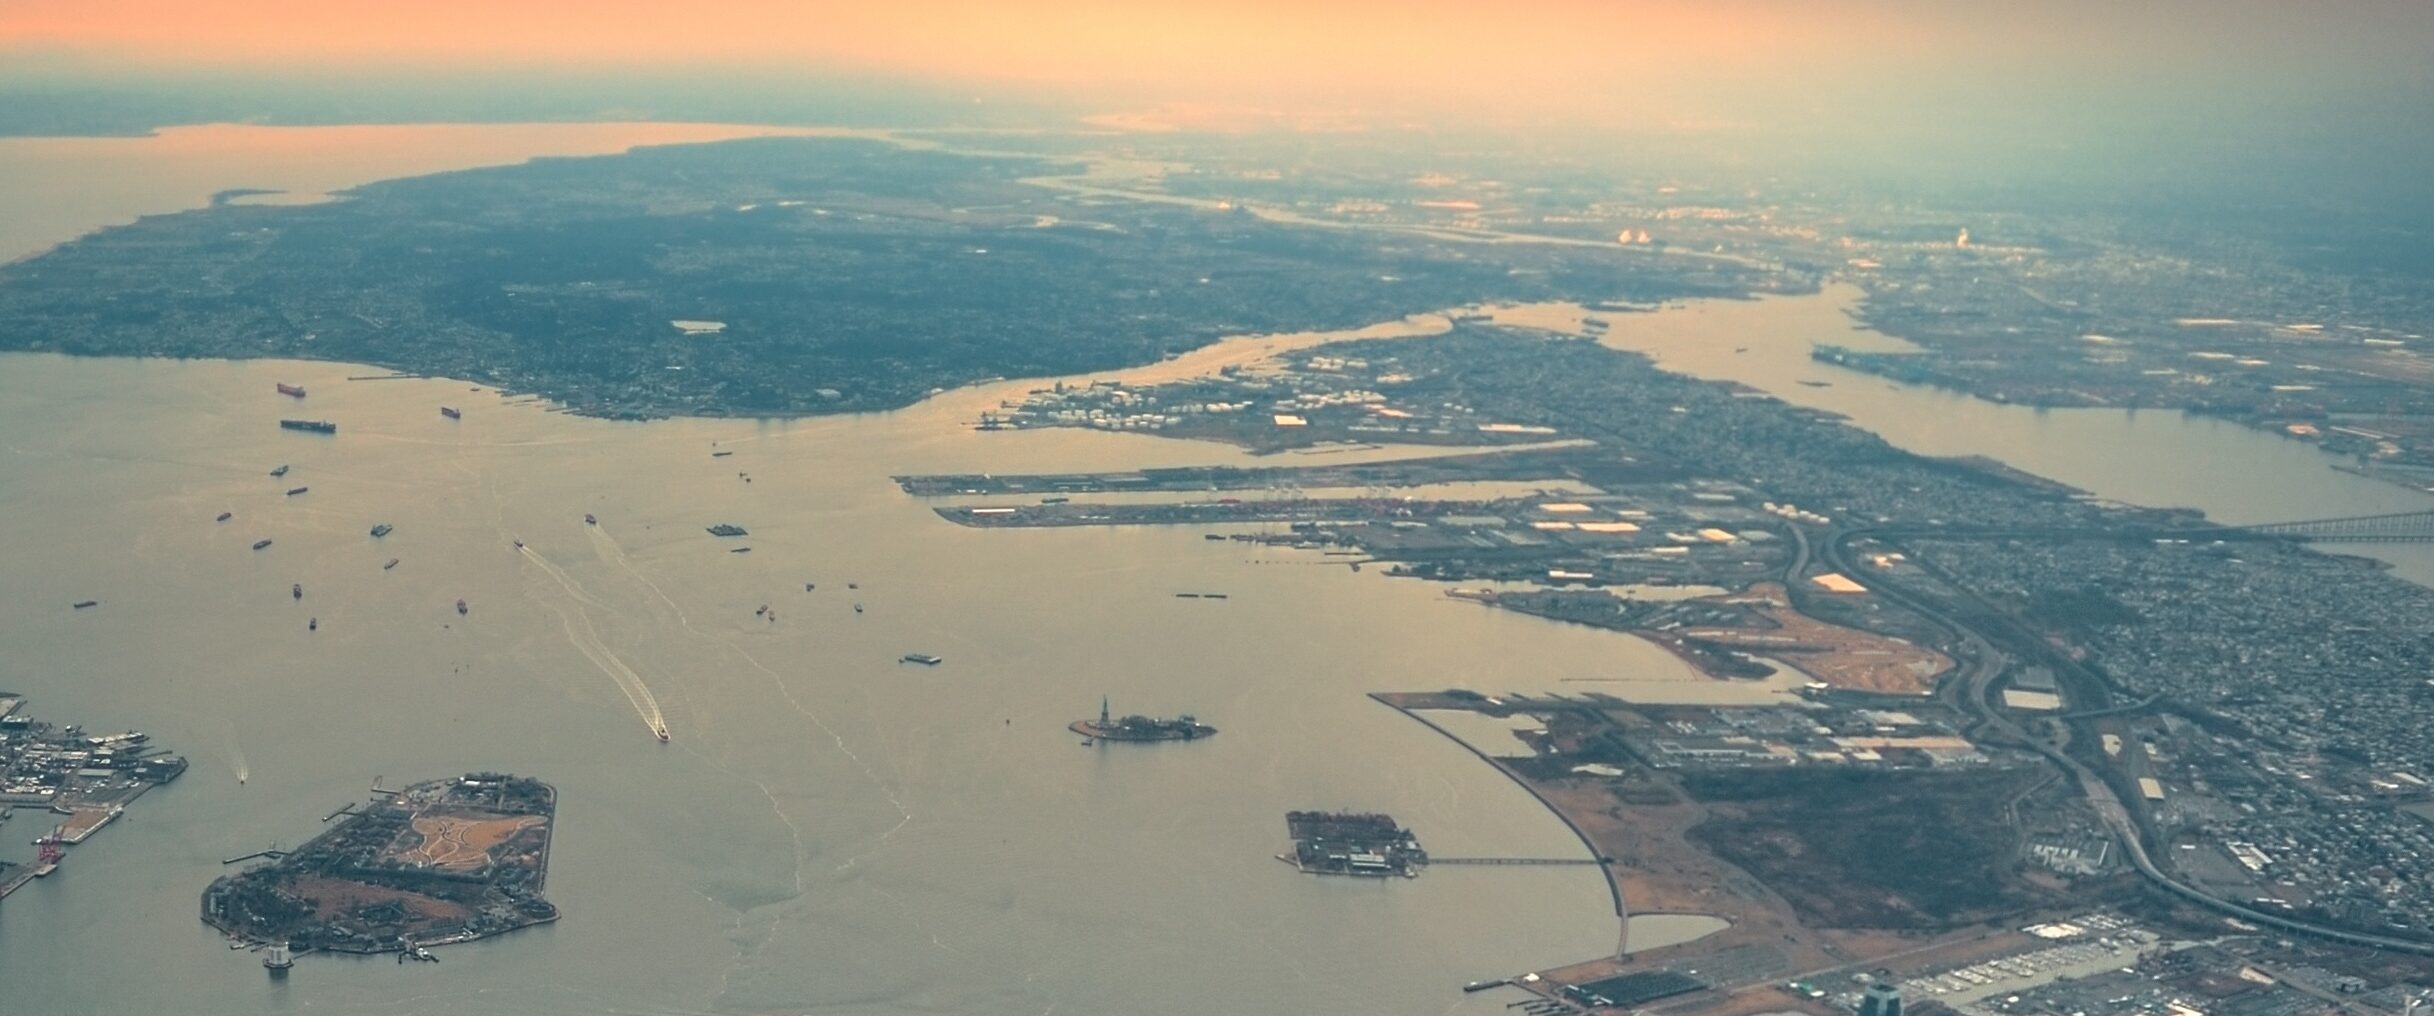

Depending on where a person lives in New Jersey, crossing the Hudson River into Manhattan can either be a cinch, or it can involve a complicated mix of buses, trains and ferries. That means someone traveling to work, school or an event in the city might have to stitch together their journey using maps, schedules and service updates posted by different agencies in different places.

For daily commuters, that extra friction adds stress. For visitors, it can turn an already complex trip into a frustrating one. The situation makes one thing clear: Riders don’t need more static maps. They need transit information that reflects how they actually travel.
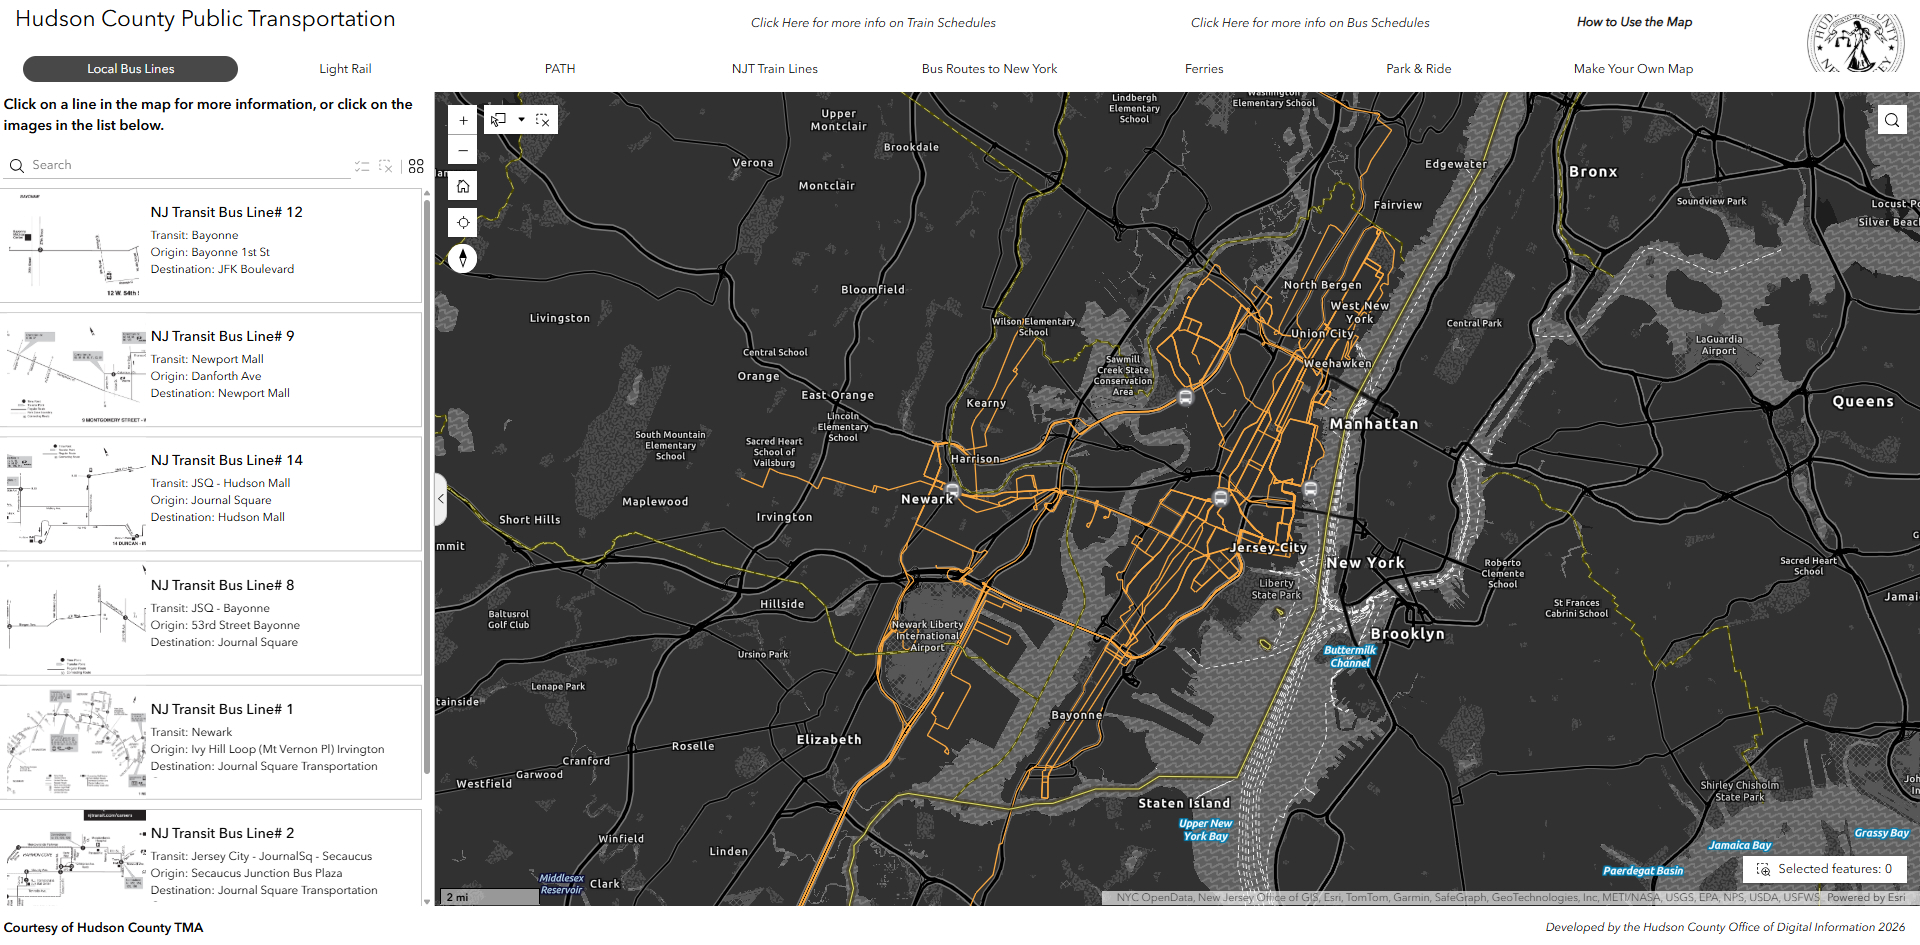
That realization prompted planners with Hudson County, New Jersey and the Hudson County Transportation Management Association (Hudson TMA) to rethink how they deliver transit information. They created a public-facing transit experience that brings buses, trains and ferries into a single, connected view on an interactive map made with geographic information system (GIS) technology.
“Static maps are great for hanging up and understanding the system at a high level,” said Daryl Krasnuk, director of the Hudson County Office of Digital Information. “But when we asked ourselves who the target audience really was — the commuter or resident — we realized that approach wasn’t ideal.”
For Hudson County, the goal was to help riders make better decisions. Transit providers already maintain a wealth of location-based information, from route maps and schedules to station locations and service details. GIS offered a way to bring those pieces together into a single view.
“The goal was to make the application easy to use, even for someone without a GIS background, while still giving people access to detailed transit information when they need it,” said Finn Hagerty, GIS specialist with the Hudson County Office of Digital Information.
Users can search for destinations, access schedules, explore routes, focus on a particular transit service, or build custom maps tailored to a specific journey.
Because transit information appears differently across devices and environments, the team evaluated color contrast, map styling, layout choices and basemaps to ensure riders could easily interpret what they are seeing.
Community feedback also shaped the application as it evolved. Early in development, ferry routes were not a major focus. Feedback from one user group revealed that ferries often become an important alternative during rail disruptions, and they provide connections other services do not. So, the team expanded the app’s ferry information.
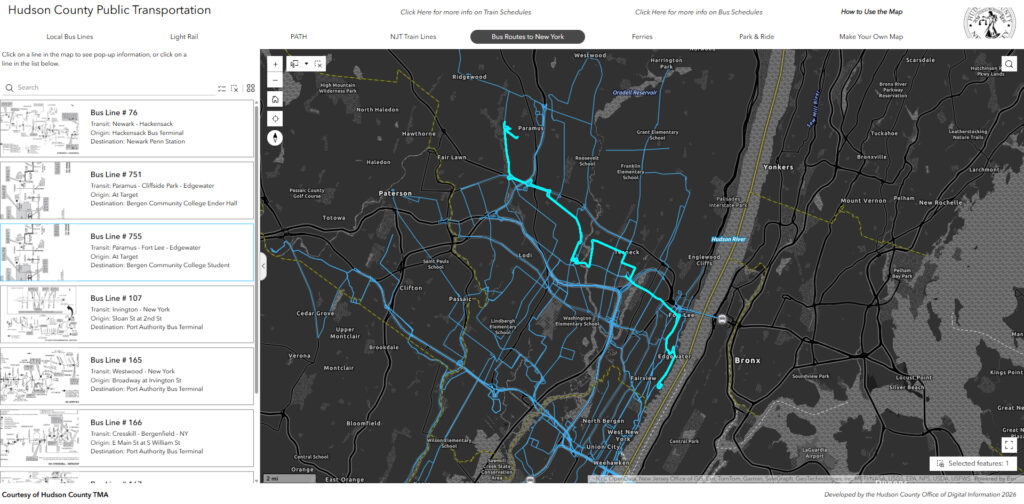
That rider perspective also influenced the scope of the application. Rather than stopping at county boundaries, the team highlighted major routes extending into New York City and across New Jersey.
Looking at transit through a geographic lens helped Hudson County and the TMA focus less on agencies and boundaries and more on the people moving between them. Riders benefit from information that reflects how they travel, while the county has a flexible public-facing framework it can continue adapting as those travel patterns evolve. As new routes come online, major events reshape travel demand, or additional transportation resources are needed, the application can evolve alongside the people who depend on it.
To learn more about how transportation agencies can organize information around rider needs and improve the public transit experience, visit esri.com/en-us/c/industry/transportation/gis-insights-for-public-transit.
Christopher Thomas is the director of government markets at Esri and a founding team member of the Industry Marketing Department. Prior to joining Esri in 1997, he was the first GIS coordinator for the City of Ontario, California. Thomas frequently writes articles on the use of GIS by government.



Leave a Reply
You must be logged in to post a comment.