
![]()
A colleague once told me about a social media report they’d received at a big meeting. It was fantastic, he said. I asked some questions, and he went to his desk and brought back a 40-page printout full of columns and of rows.
Clearly, someone had exported Excel or CSV file reports directly from the social networks and packaged them all together in one document.
“Isn’t this great?” he asked excitedly. To which I replied, “No, this is pretty bad. Who would actually read this?” I then asked if he would give a report like that to his director, and if leadership would even know what to make of it if he did.
Crickets.
Don’t overthink it—you don’t have to measure everything
Social media reporting can be intimidating because it’s perceived as difficult to do. I try to simplify things as much as possible so that people will actually read my reports. Social media metrics only work if they are simple and easy to follow.
Our job is to make it easy for readers—whether that’s managers, teammates, stakeholders or constituents—to grasp the story we’re trying to tell with data.
To do that, you need simple metrics. At King County, Wash., I prioritize a few key items:
- Interactions (likes, comments and shares, for example)
- Link clicks (to our website, ideally)
- Engagement per post (here’s what happens every time we post something)
To get these numbers out of complicated (and let’s face it, confusing) export files, I created a “cookbook” with the ingredients you need to whip up a tasty social media report.
Here’s what part of my monthly report looks like for Facebook and Twitter:
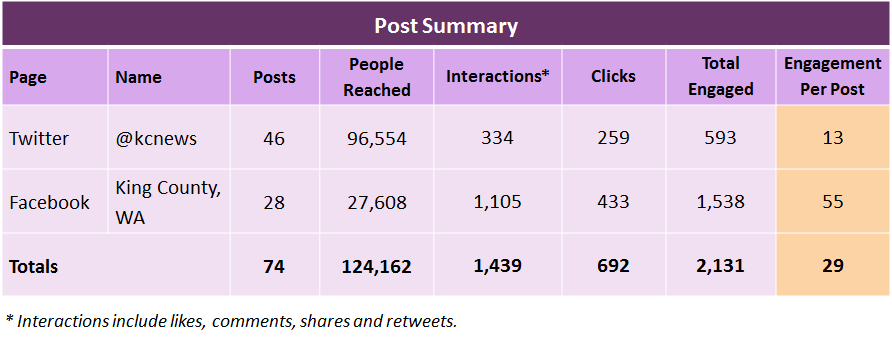
The data above allows me to present important information quickly. It’s easy to scan, and therefore easy to follow. This particular month, our main Facebook and Twitter accounts reached 124,000 people and drove 700 clicks to the county website. I also include a list of the top 10 tweets and Facebook posts for the month.
Finding these metrics is easy if you follow a few simple instructions:
Facebook Insights cookbook (5 steps)
- Go to your page’s Facebook Insights and click the small “Export” link in the top right corner. Set the dates you want to measure, and then choose “Post Data” and “Export Data.”
- If you’re tracking reach or impressions, Columns I, J, K and L on the Excel tab titled “Key Metrics” gives you total, organic and paid reach as well as total impressions.
- To calculate your interactions, find the tab “Lifetime Post Stories” and add the numbers in Columns J, K and L.
- Link clicks are in Column J of the tab “Lifetime Post Consumers.”
- Add interactions and clicks, and divide by the number of posts you made during the reporting period to determine your engagement per post.
Twitter Analytics cookbook (6 steps)
- Go to Twitter Analytics and choose “Tweets” from the nav bar at the top of the page.
- Find the button in the upper right corner called “Last 28 Days” and select the month or reporting period you want to measure. Choose “Export Data.”
- If you’re tracking reach or impressions, Column E has this information.
- To calculate your total interactions, add the numbers in Columns H, I and J.
- Column L is where you’ll find link clicks.
- Add interactions and clicks, and divide by the number of posts to determine your engagement per post.
Goal: deliver reports that are easy to scan
Presentation is everything. If you have to explain too much about social media metrics, chances are you’ll lose the attention of a few key audience members. You want reports that are easy to read and, most importantly, easy to scan in a busy meeting.
In this profession, we have to assume people don’t know much about social media outside of personal use cases. But measuring public engagement on Facebook isn’t the same as baby announcements or vacation photos. Who cares how many likes a post got if no one clicked through to the actual survey page?
If you’d like to see the 2-page template we use for monthly social media reports at King County, please email me and I will happily share it with you.
Good luck, and happy reporting!
Derek Belt is part of the GovLoop Featured Blogger program, where we feature blog posts by government voices from all across the country (and world!). To see more Featured Blogger posts, click here.


Thank you for this very helpful breakdown! It can be difficult to cut through all the information analytics can provide and find what’s truly useful, so I’m sure this post will be helpful to many groups.
Love this! For someone who collects data, I completely agree it is important to find the information important to your agency. Thanks for sharing!
Awesome cookbook, Derek. As always, you present such useful information broken down into easy to follow steps. Thanks for guest lecturing last week, too! UWSMC students love your presentations!