

There are three ways to analyze survey responses: discuss responses question by question, conduct cross-tab analysis, and compare the results of multiple surveys taken at different times. It is ideal to describe results with both text and graphs, as people understand findings in various ways. Summaries of results could include the most salient graphs with little analysis.
The type of graph (i.e., bar graph or circle/pie graph) may vary depending on the question. What if the question were: How many medical appointments have you had during 2024?
A graph could be one of the following:
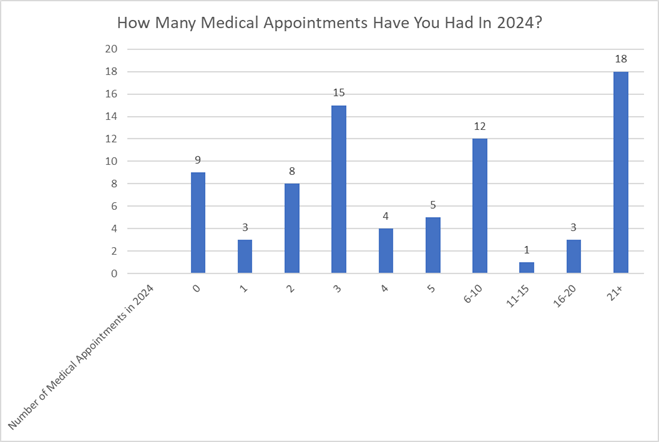
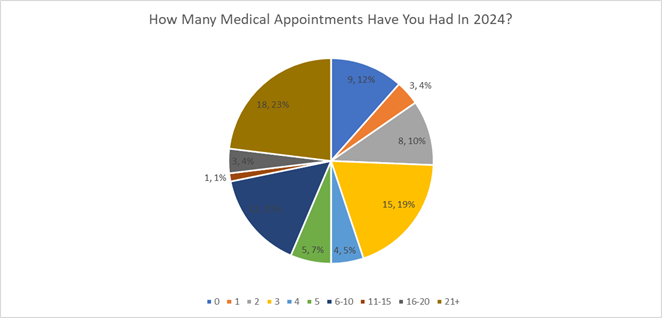
The second graph provides more information because it shows percentages.
However, what if the question were: Which of the popular social media sites do you go to at least once a week (Choose all that apply)?
A graph could be:
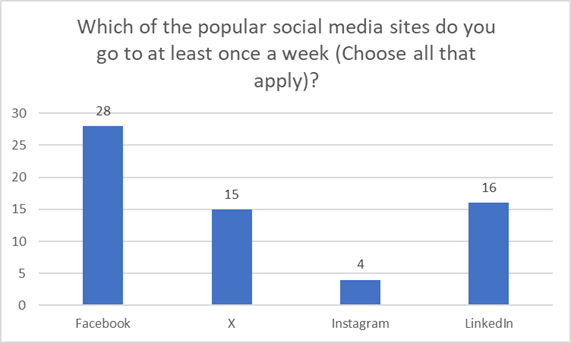
A circle graph would not make sense because the number of total visits is the key result. Percentage is not important.
Question-by-Question
Question-by-question analysis involves a simple explanation of the results of individual questions. The analysis could take one of the following formats: question, graph, or analysis in text (offering first the results and then the takeaway). The same format could apply to cross tabs and comparing the results of multiple surveys.
Cross Tabs
Cross tabs yield more nuanced and complex results than question-by-question analysis. Cross tabs show the relationships between at least two survey questions and provide a side-by-side comparison of how different groups of respondents answered them.
Most likely, some possible cross tabs won’t be useful. Thus, create just the cross tabs that you think would be valuable. Many beneficial cross tabs could involve a demographic-related question (i.e., How old are you?) and another question, since people of different demographic groups could behave and, thus answer, questions differently.
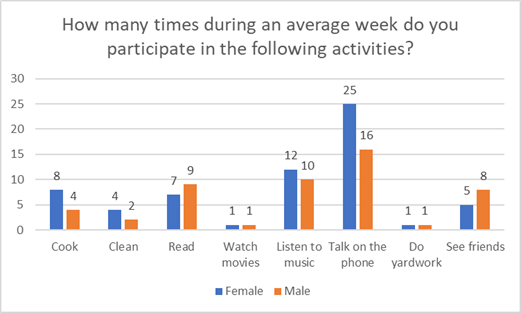
As the results are more complicated, so are the graphs. Many graphs for cross-tab analysis are sets of multiple bar graphs. An example of a set is:
Comparisons of Results of Multiple Surveys Conducted at Different Times
You might want to conduct the same or slightly different survey at different times (such as every year). For instance, organizations may want to have annual membership questionnaires. By comparing results of those surveys, you can see possible changes (i.e., average number of visits to the organizational website and social media sites each month).
Organizations may also conduct pre- and post-program questionnaires, which show potential effects of initiatives. For example, an organization conducting a training on different types of diseases could ask in its survey: “Rate your knowledge of lung cancer (from one to five, with one being the lowest and five being the highest).”
Graphs for this type of section could also be sets of multiple bar graphs. Thus, they could be similar to cross-tab graphs.
Concluding Thoughts
After analyzing survey results, be sure to share your results. Results can be discussed in e-mails, reports, and websites. Highlighting key results to survey respondents shows that completing surveys matters and that you value people’s input.
Miriam Edelman, MPA, MSSW, is a Washington, D.C.-based policy professional. Her experience includes policy work for Congress. Miriam’s undergraduate degree is from Barnard College, Columbia University, with majors in political science and urban studies. She has a master’s in public administration from Cornell University, where she was inducted into the national honorary society for public administration. She has a master’s of science in social work (focusing on policy) from Columbia University. She is a commissioner of the DC Commission on Persons with Disabilities. Miriam aims to continue her career in public service. She is especially interested in democracy, civic education, District of Columbia autonomy, diversity, health policy, women’s issues, and disabilities.


Leave a Reply
You must be logged in to post a comment.