
Leaders in Louisville, Kentucky — hoping to bring an end to road deaths by 2050 — are using smart mapping technology to pinpoint where fixes can save lives. What they’ve documented, using geographic information system (GIS) technology, is that harm is happening more often in historically underserved areas.
The city now has $21 million in US Department of Transportation (DOT) grant funding after applying for a Safe Streets and Roads for All grant, in partnership with the Kentucky Transportation Cabinet and Palmer Engineering. Central to the funding request were data and maps that identified and compared high-risk locations based on crash analysis, roadway designs, and vulnerabilities in communities. Ultimately, 10 corridor projects came into focus.
The projects aim to improve roadways with features such as better lighting, medians, and bicycle lanes. All 10 will also be rightsized, a proven safety measure from the Federal Highway Administration that promotes safer speeds, often by adding a dedicated left-turn lane or removing lanes.
Prioritizing Projects with Greater Awareness
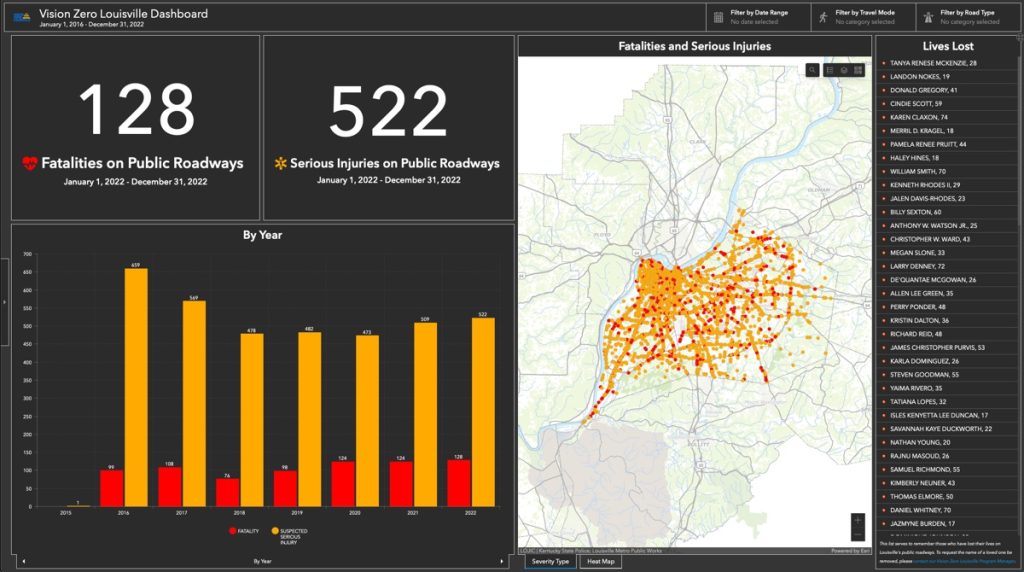
Louisville’s Department of Public Works used GIS to first map traffic fatalities and serious injuries, assessing hot spots and patterns. More than 900 people had lost their lives on Louisville’s roadways since 2014, including 185 pedestrians.
With that awareness, the Louisville Metro Council passed its Vision Zero Louisville Ordinance in 2022 with the goal of eliminating road deaths by 2050. They aimed to take more proactive approaches and make transportation network improvements that, “reduce the likelihood of crashes happening at all,” according to Amanda Deatherage, transportation planner supervisor for Louisville Metro Government.
That’s how the city homed in on improving 10 roadway corridors.
“The work to prioritize those projects was all a GIS exercise,” Deatherage said. “GIS analysis is woven through the work that we do. It’s the foundation for a lot of our decision-making.”
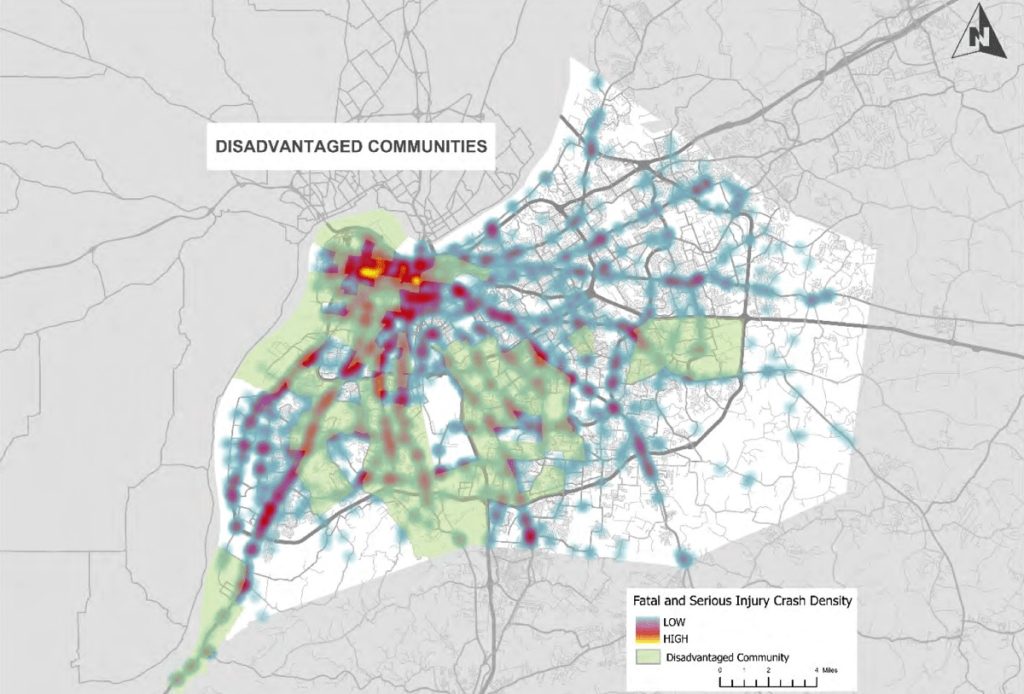
While crash data was critical, it didn’t tell the whole story. GIS provided greater context through analysis of data from US DOT, the Kentucky Transportation Cabinet, and internal sources, as well as from Esri’s ArcGIS Living Atlas of the World. The Living Atlas gave Louisville the data it needed to consider an area’s social vulnerabilities and prioritize improvements made in underserved communities.
A goal of the federal Justice40 Initiative seeks to address chronic underinvestment in disadvantaged communities by dedicating at least 40 percent of funding to closing gaps. Six out of 10 of Louisville’s projects are in underserved areas.
Enacting Safety Measures to Save Lives
With projects in place to construct safer roads, the leaders of Vision Zero Louisville next focused on safer speeds.
The city owns and manages 2,100 miles of roadway. A preliminary audit revealed seven stretches of road with posted speed limits that exceed 35 miles per hour. From 2016 to 2022, four people were killed and 27 people were seriously injured on those seven stretches of city-owned road. The city is now working to reduce speeds there.
At Louisville’s inaugural commemoration of the World Day of Remembrance for Road Traffic Victims in 2022, a mother reminded those gathered of the stakes.
“No reset button can be pressed to bring back those killed. The best way to honor them is by making our streets safer,” said Janet Heston, who founded the nonprofit Matthew’s Bridge in honor of her son who was killed while crossing a Louisville road.
Learn more about how GIS improves transportation and how the Vision Zero solution helps municipalities deliver safety results.
This article originally appeared in the Esri Blog.
Christopher Thomas is the director of government markets at Esri and a founding team member of the Industry Marketing Department. Prior to joining Esri in 1997, he was the first GIS coordinator for the city of Ontario, California. Thomas frequently writes articles on the use of GIS by government. Follow him on Twitter @GIS_Advocate.


Leave a Reply
You must be logged in to post a comment.