
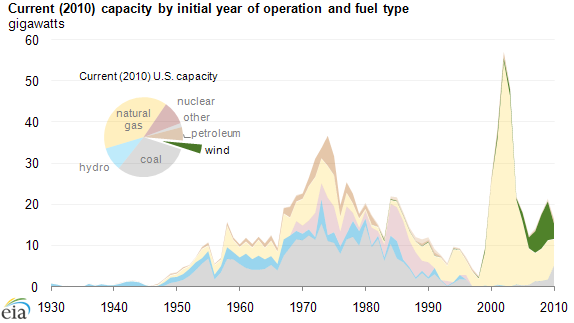
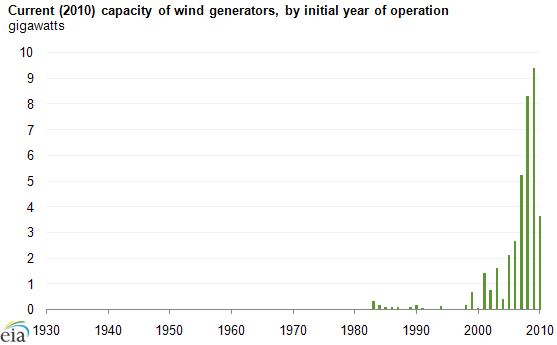
Last week, the EIA released two great charts that display the expansion of the country’s wind energy capacity in the years after 2005. In the chart above, 2009 stands out as a particularly great year for wind. But 2010 did not build on the momentum from 2009; why? According to the EIA’s brief text that accompanied the two graphs we’re sharing with you today, it’s because of “economic downturn and an uncertain regulatory environment (particularly relating to the renewal of production and investment tax credits)…”
Photos via EIA.


Leave a Reply
You must be logged in to post a comment.