


The city of El Cajon, California invests in homelessness outreach programs and cleanup operations and directs $1 million annually toward services. Until recently, its residents were largely unaware of the efforts.
The city’s response was to move beyond another report or collection of statistics. Instead, IT director Sara Diaz and her team set out to combine information from multiple departments and explain the complex issue in a way that would be helpful to residents.

The result is the resource, Addressing Homelessness in the City of El Cajon. Built with geographic information system (GIS) technology, the experience combines maps, dashboards and narrative to show where homelessness is occurring, where services are available and how the city is responding.
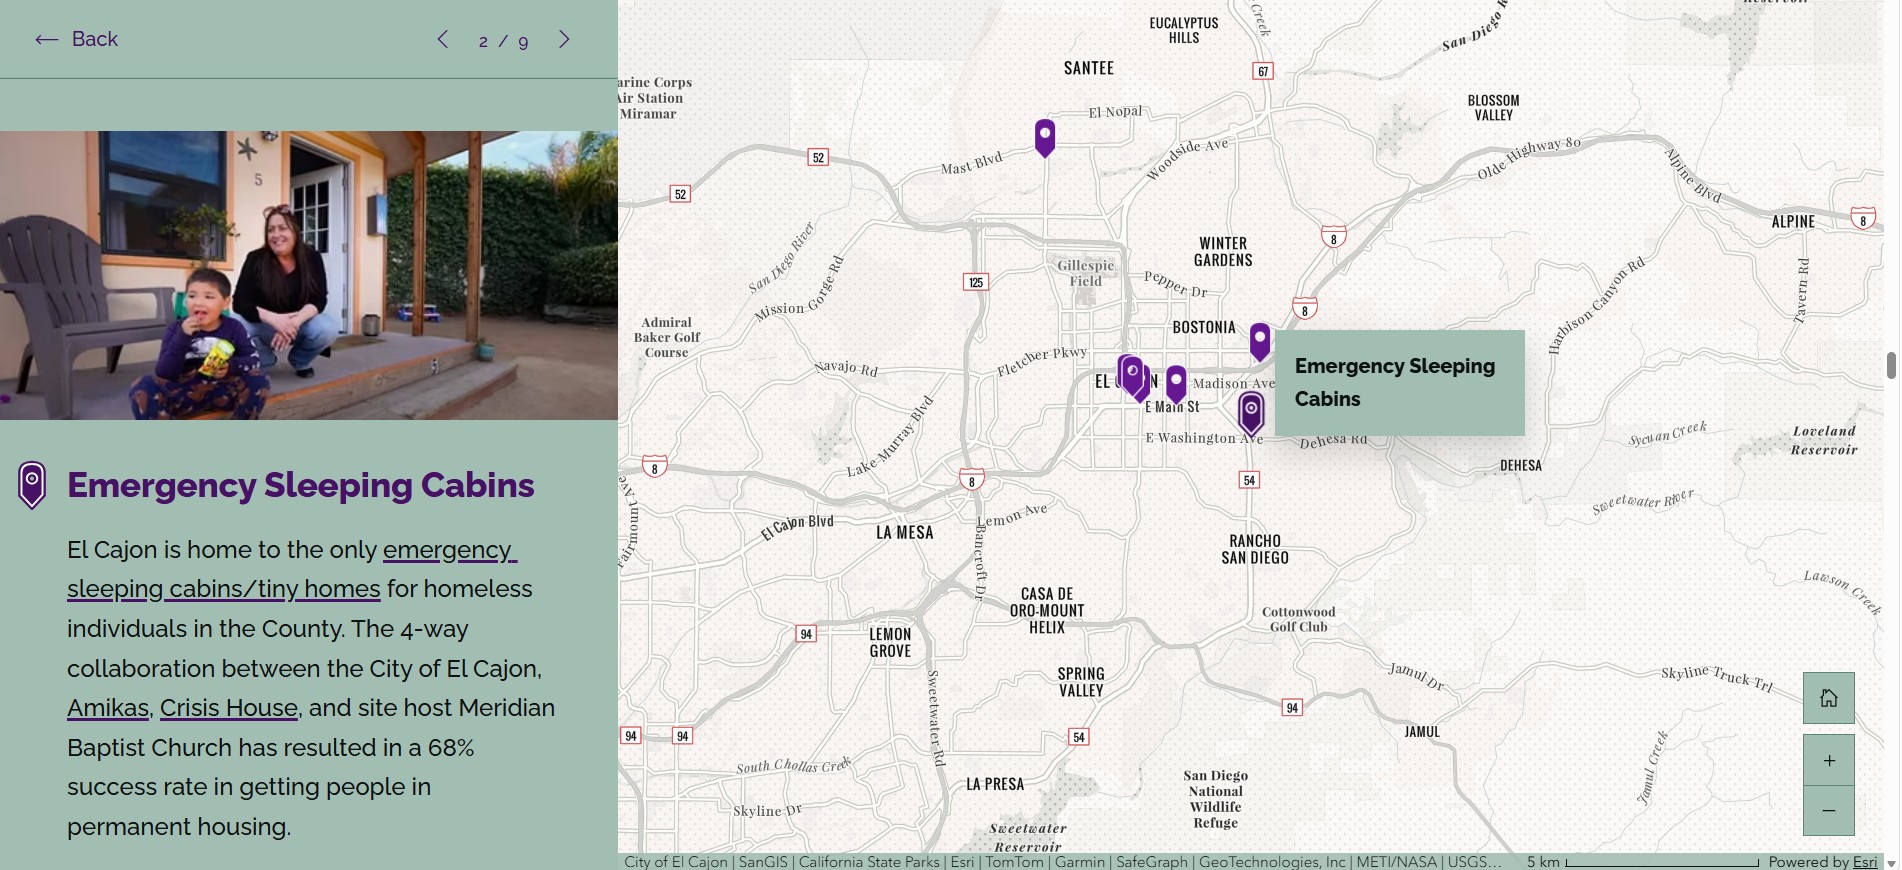
“The goal was to present the data in a really easily digestible format for many different audiences, with live and interactive features where viewers can draw their own conclusions,” said Emily Orsborn, a city GIS analyst. An interactive map acts as a tour, guiding residents through the service locations and homeless outreach facilities across the city. Each location includes details about the provider or program. Residents can use the map to find places to volunteer or donate and learn how to connect people experiencing homelessness with services.
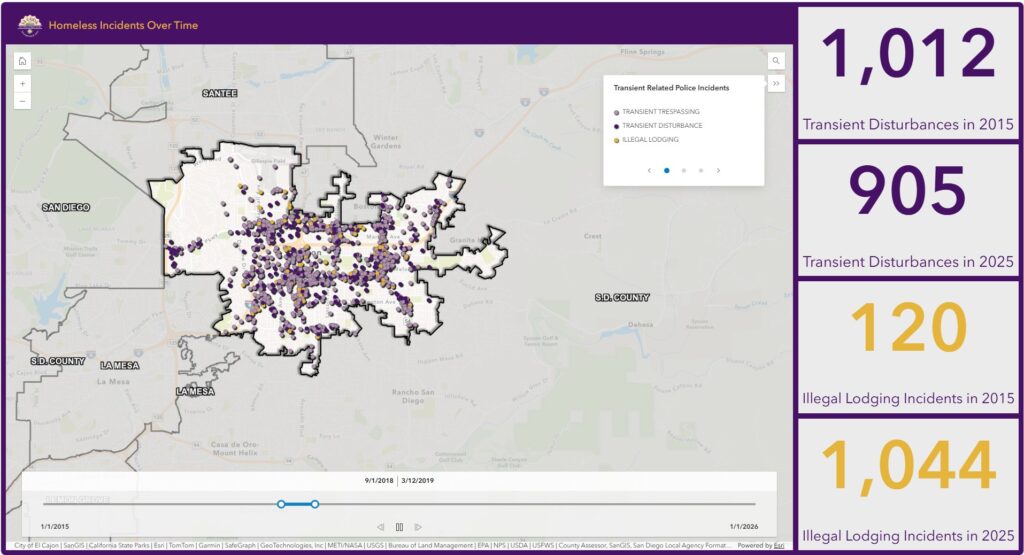
Another feature is the homeless incidents time slider. Drawing on 10 years of police call data, it shows how and where incident patterns shift across the city year by year. As the slider advances, points on the map change to reveal where transient-related calls were concentrated, while indicator widgets alongside the map track totals for each call type. A resident can use this to see whether incidents are increasing or decreasing in their neighborhood. “You can draw from that information about the homeless population and the incidents over time,” Orsborn said. “It really tells a story.”
Residents can also explore current incident activity across the city. Heat maps show concentrations of illegal lodging, trespassing and disturbances. Dashboards track those incidents and related arrests over the previous six months. The maps and dashboards are updated daily through an automated workflow that connects the city’s computer-aided dispatch system to its GIS platform.
If anything goes wrong, the system sends an automatic error notification to the GIS team.
Building a Public Resource from Disconnected Data
Residents can also see how the city is responding to incidents. The city’s homeless task force operations dashboard shows weekly encampment removals and waste-collection efforts. Task force staff record that information using a mobile GIS survey app that automatically syncs to the platform.
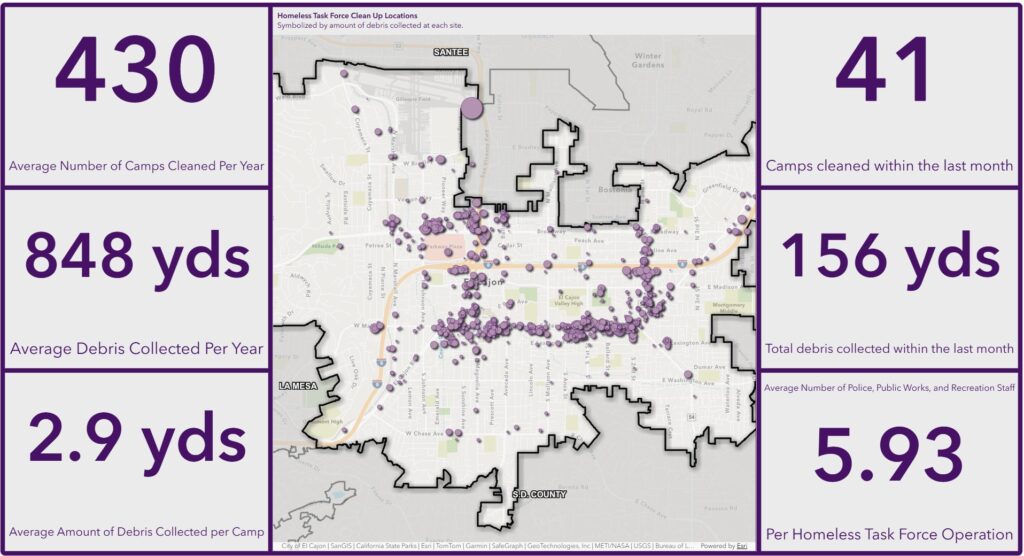
Before GIS technology was involved, the homeless task force tracked cleanup operations on paper — often via handwritten notes that were difficult to analyze consistently. Shifting to digital forms standardized the inputs and made the data easier to work with.
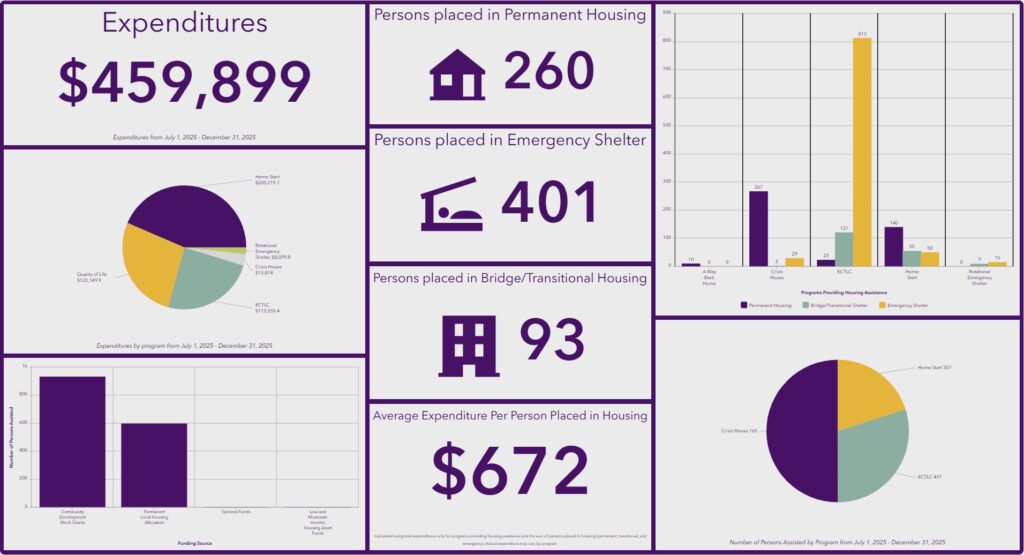
“The data that we get is only as good as the methods used to collect it,” said Kate Gallegos, a GIS analyst for the city. “We can only control the data we’re collecting, but we’re reliant on outside sources as much as our own.” Funding is another key part of the city’s response. To help residents understand how public dollars are being spent, a GIS dashboard tracks funding and expenditures for local homeless service organizations. El Cajon Development Services personnel enter funding and expenditure data using the same GIS survey app.
Another dashboard shares results from the city’s annual homeless point-in-time count, helping residents understand who is experiencing homelessness and what services may be needed. For the count, the GIS team uses a custom form built on the same GIS survey app. Results automatically feed into an interactive dashboard on the story. The city includes those results alongside information received from San Diego County’s county-wide homeless count. For instance, El Cajon’s January 2026 survey revealed a growing need for family services, a rising average age among the homeless population, and that two-thirds of El Cajon’s unhoused residents previously had residences in the city.
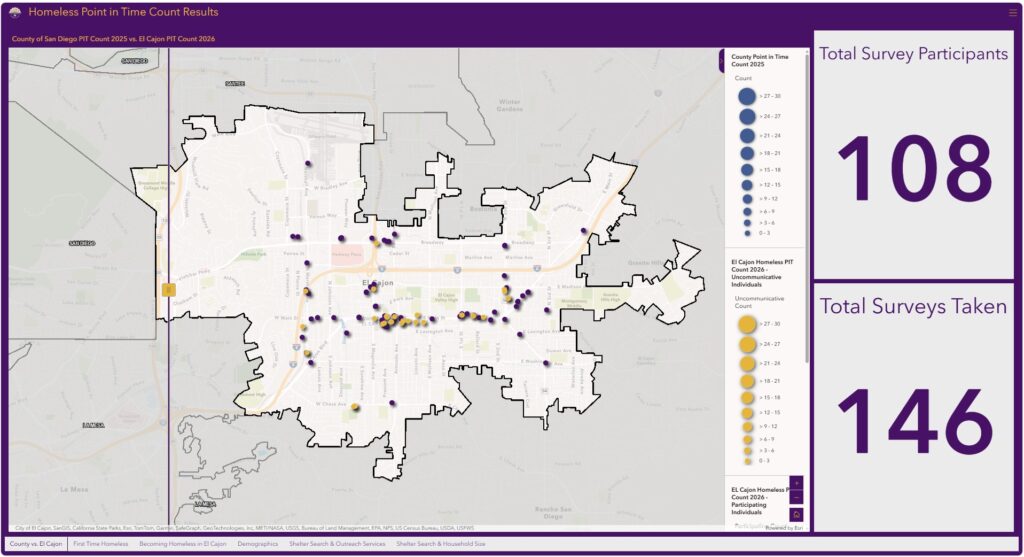
The team also built view ranges and layer restrictions into the public-facing maps to protect sensitive information, such as the exact locations where unhoused individuals were encountered during outreach.
How Awareness Is Shaping Decisions
The project required buy-in across departments — police, public works, development services and IT were all involved — and the team credited early support from city leadership as essential.
“If you’re going to do something like this, you’re going to need support from many departments,” Diaz said. “Having that top-level consensus was critical for this project.”
The team took a hands-on approach to understanding the problem. They went on ride-alongs with the homeless task force, joined staff during data collection and participated in 4 a.m. point-in-time homeless counts.
“You can’t tell a story you don’t understand yourself,” Orsborn said.
The resulting maps and analysis are now helping guide city decisions. El Cajon is bringing in new service providers and structuring contracts around identified needs. For example, in response to the rising average age of the city’s homeless population, outreach teams shifted their plans around which services to offer.
Service providers are also using the GIS dashboards to understand the city’s funding priorities before competing for contracts.
The project is drawing attention from outside the city. Locally, the San Diego County Taxpayers Association recognized El Cajon’s work with a Golden Watchdog Award because of its effective, transparent use of public funds. And after the team presented their work at the 2026 Esri User Conference, counties and cities from across the country reached out asking how they could replicate the model in their own communities.

(Left to right: city manager Graham Mitchell, GIS analysts Emily Orsborn and Kate Gallegos, and IT director Sara Diaz.
Learn how cities use GIS to address housing and homelessness.
Angel Baltazar is director of health and human services at Esri, where she works with public health, human services, hospitals, and health systems to apply GIS and location intelligence that improves community outcomes, aligns resources, and strengthens service delivery. She brings experience across county health and human services, hospital systems, nonprofits, and philanthropy. Baltazar holds a Doctor of Education from the University of La Verne and a Master of Social Work from Loma Linda University.



Leave a Reply
You must be logged in to post a comment.