
This blog post is an excerpt from GovLoop’s recent guide, How You Can Use Data Analytics to Change Government. Download the full guide here.
The Challenge: Fighting the Opioid Epidemic
In Indiana, news stories about Hoosiers who are addicted to opioid are driving more open conversation about the state’s growing drug epidemic. The stories are about people like Cheryl Dicken, who, according to The Indianapolis Star, “found her son unconscious in a heroin-induced haze,” and Joan Moon, “whose grandson has been addicted to drugs since 2009.”
These hurting families are the face of a larger problem that demands more answers, more insight and, inevitably, more meaningful data. Although personal stories humanize the drug epidemic, stories alone are not the solution.
Law enforcement officials, public health agencies, lawmakers, and the community need sound data to shape their collective response to the problem. But when that data is stored in different systems at different agencies, making use of it requires hard work and collaboration.
Spurred by serious concerns about the rise of opioid use statewide — and a fascination with data — Joshua Martin, Chief of Staff for the Indiana Management and Performance Hub (MPH), decided to act.
It was in August 2014 that Martin noticed a rise in media coverage of heroin-related incidents. That was about the same time MPH deployed a new business intelligence tool to help its agency customers make data-informed decisions.
The culmination of these events got Martin thinking: Wouldn’t it be interesting if the state could use data to better understand the changing nature of the drug problem?
Historically, decision-makers have had to rely on whatever information was available to make the tough choices, but what they had access to was not always the best information. Sometimes the people who were asking the questions didn’t have access to the right data, and neither did the people writing policies.
“There’s a real human element to using the data to inform the policy decision-making around these problems,” said Dave Matusoff, Executive Director of MPH.
The Solution
It has only been a few months since MPH stood up its drug data dashboard internally and began enlisting the help of other agencies — the data owners. The project is still in its infancy, but that hasn’t detracted from the real work underway.
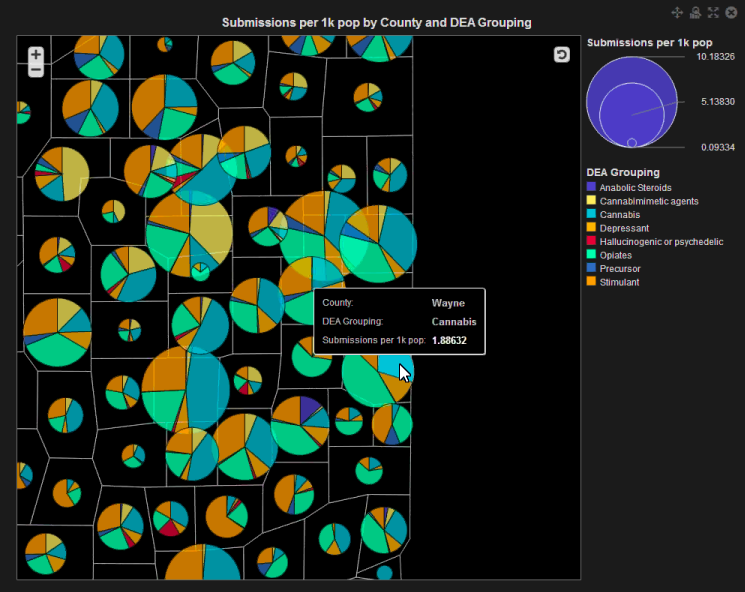
The MPH team has worked closely with Indiana’s police forensic laboratories to track and visualize the types of illegal substances that officers are finding on the street, and how often they’re finding them. The most recent data (to November 2015) showed a dramatic rise in heroin submissions to the lab but a steady decline in other opioid submissions, namely prescription drugs.
Matusoff pointed to a 2013 state law aimed at tackling the opioid epidemic as a contributing factor in the decline of prescription opioid abuse. The law was passed to tighten prescribing practices, close down so-called “pill mills” where physicians and other providers illegally prescribe and issue narcotics, and reduce opioid abuse and ultimately deaths. The General Assembly’s intentions were good, but the data shows unintended consequences.
“When they passed that legislation, it was harder for addicts to get prescription drugs,” Matusoff said. “You saw a dramatic decline in the number of prescription narcotics submitted to the forensics lab, but then you saw a really dramatic rise in the heroin use. So you can begin to look at — in a very real-time way — the unintended conse- quences of policy.”
In November 2015, the MPH team started formalizing the dashboard and soliciting data and input from law enforcement and public health agencies. Using the business intelligence tool, MPH can visualize data by creating geospatial maps, color-coordinated line graphs with trend data and even a time-lapse map that shows how the drug epidemic has evolved over time.
MPH isn’t just collecting data on laboratory-tested substances. The team is also looking at opioid-related deaths and geospatial data for certified treatment providers across the state.
This is the first time all these data sets have been combined to tell a complete story, Martin said. A quick look at these visual maps makes clear that the drug problems vary by county.
 One color-coded map in particular shows the number of per-capita, opioid-related deaths by county. Southeastern Indiana has been hit by this epidemic especially hard. In October 2015, The Indianapolis Star reported “more than 180 people in or near Scott County were diagnosed with HIV after sharing needles to inject prescription pain medication.”
MPH is exploring the role that data will play in combating the state’s devastating drug problems. In January, the team presented its work to the Governor’s Task Force on Drug Enforcement, Treatment, and Prevention, and it expects to continue collaborations with other state agencies. But that’s not all. The team also has its sights set on providing similar data analytics services to other states facing their own issues.
“This is still a work in progress, but what we’re trying to do here is take these mountains of data that are in different places and turn data into information, turn that information into knowledge, and hopefully turn that knowledge into policy,” Martin said.


Leave a Reply
You must be logged in to post a comment.