

As Los Angeles County works to close its digital divide, maps are playing a lead role — showing lawmakers why and where action is needed most.
“It’s one thing to say we know that people don’t have the internet, but when you look at where it’s happening, that just speaks volumes,” said Selwyn Hollins, director of Los Angeles County’s Internal Services Department.
Hollins and his department staff have been using geographic information system (GIS) technology to add layers of relevant data to maps and dashboards. This location intelligence helps identify areas to focus on equitable broadband expansion. Maps and dashboards can also be used to communicate with policy makers and the public — and to attract telecom partners.
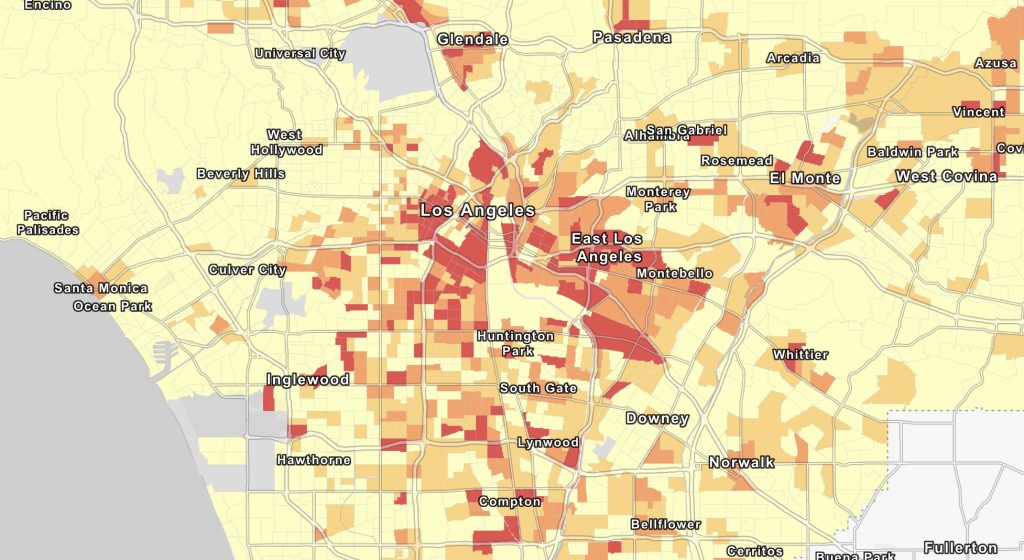
What the maps have revealed so far: urgent need and stark disparity. Hollins’s team combined map layers for internet service quality and costs with demographics like income level and race.
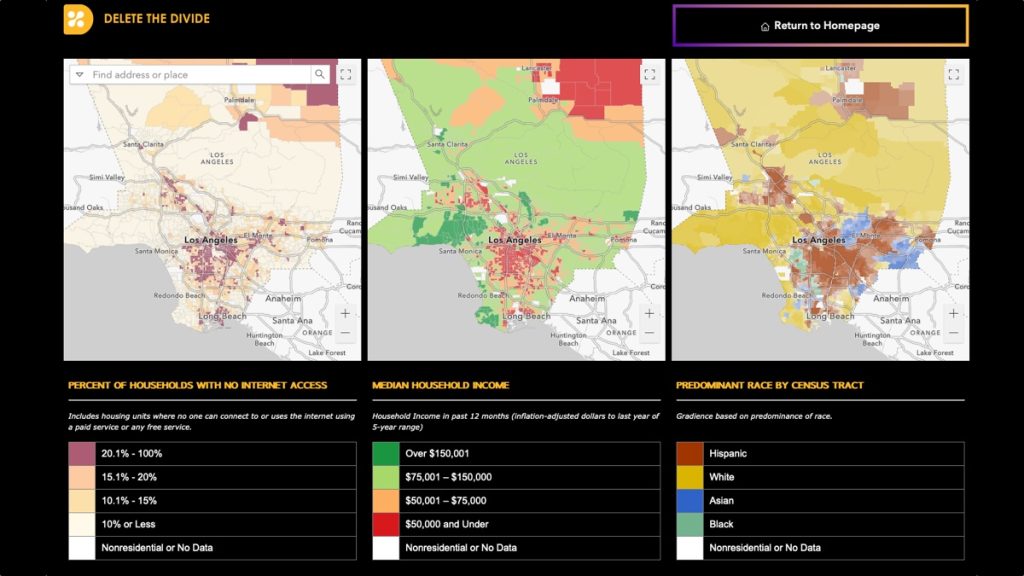
In Boyle Heights and Watts, two neighborhoods with mostly Black or Hispanic residents and historically low household incomes, more than one in four households lack in-home internet, according to county census data. By contrast, all but about three percent of households in the mostly white and wealthy enclaves of Brentwood and Pacific Palisades are well-connected.
“When I showed the maps to policymakers, everyone in the room was speechless,” said Hollins. “Here’s where it is, and it’s in your political district. How can we ensure that the efforts and the attention go to those gaps that you have in your district? And why is it like that? Spatial awareness enabled that conversation.”
Making a Plan With Maps
Last year, the Los Angeles County Board of Supervisors approved an unprecedented multi-year internet expansion plan. The project is aimed at delivering wireless broadband to the hundreds of thousands of low-income households that don’t subscribe to high-speed service.
The plan also includes using state and federal grants for administering a fiber network in partnership with existing providers. One goal is to be able to provide 100 Mbps monthly service, more than enough speed for a household’s internet needs, at no cost or low cost for low-income residents.
The county hopes to switch on a part-fiber, part-wireless network to reach as many as 40,000 households initially and expand it to eventually reach 400,000.
Hollins’s maps are supporting the expansion by showing areas of opportunities for public-private partnerships. Service providers can place antennas and other equipment on existing light poles and municipal infrastructure and buildings, eliminating cell tower leasing costs and reducing construction costs or disruptions.
Using Maps From Start to Finish
GIS layers can show a constellation of variables — like the physical extent of fiber-optic lines, service areas, the incumbency of various providers, the level of service provided, and the county’s physical assets. By visualizing the physical terrain in GIS, planners can situate infrastructure most efficiently, with the least amount of material and digging.
As a system of record, GIS also helps county staff track grant applications, bids, and other funding requirements while chronicling work progress, materials, and network operations.
Hollins expects the maps will make the county competitive for millions in federal infrastructure dollars by showing how carefully it plans to spend on upgrades.
Ultimately, leaders in Los Angeles County aim to deliver essential internet services where they are needed most. By analyzing and visualizing all relevant data on interactive maps, county leaders can see optimal places to bridge equity gaps.
Learn how local governments can use maps and spatial analysis to expand equitable broadband with federal funding.
This article originally appeared in the Esri Blog.
Christopher Thomas is the director of government markets at Esri and a founding team member of the Industry Marketing Department. Prior to joining Esri in 1997, he was the first GIS coordinator for the city of Ontario, California. Thomas frequently writes articles on the use of GIS by government. Follow him on Twitter @GIS_Advocate.


Leave a Reply
You must be logged in to post a comment.