
Maintaining a diverse federal workforce and eliminating barriers to equal employment opportunity are not only required practices for federal agencies under the Equal Employment Opportunity Commission’s Management Directive 715, but are also crucial to encouraging a more effective and creative workforce with less internal strife. The private sector is now investing heavily in diversity programs to enhance their workforces and by extension their bottom lines. Business Insider reports that Google just announced it will spend $150 million this year on increasing gender, racial and ethnic diversity—not in response to a lawsuit or government audit—but as a proactive step to improve the business.
The benefits of diversity should certainly be achieved in the federal sector as well. But how can an agency start to determine if its workforce is diverse (and what does it mean to be “diverse”), or if a certain employment practice is disproportionately preventing certain groups from enjoying full equal employment opportunity?
The EEOC recommends that agencies use an initial statistical “snapshot” as a starting point to guide a more in-depth analysis of workforce data. There are a few sound statistical techniques that can help provide that initial snapshot to identify improvement opportunities for an agency’s diversity profile.
Statistically comparing your workforce to the overall U.S. Workforce:
One benchmark to use for an agency-wide comparison could be the National Civilian Labor Force as measured by the U.S. Census Bureau. The most recent data available on the Census website for the U.S. workforce is from the 2006-2010 American Community Survey EEO Tabulation.
A statistical technique called the normal approximation to the binomial can map the expected observations of a certain group within the workforce on a normal distribution, and compare how an agency’s workforce percentages compare statistically to the Census benchmark. A calculation of the z-score (or number of standard deviations) from the expected number of observations can help determine how far away from the agency falls from matching the Census workforce percentage.
Real Life Example:
The Census EEO tabulation indicates that 52.9 percent of the U.S. workforce is male, and 47.1 percent is female. How likely is it for an agency of 10,000 employees to be 46 percent female (4,600 employees) or less, if the agency draws from the full spectrum of the U.S. workforce?
If the agency were exactly representative of the total civilian workforce, it would have 4,710 female employees. The number of standard deviations, or z-score, from this goal, calculated using the normal approximation to the binomial technique, is equal to the difference between the observed and expected values, divided by the standard deviation for the population (equal to the square root of the total number of employees, times the benchmark percent male, times the benchmark percent female). The z-score is about 2.2 standard deviations ((4,710-4,600)/sqrt(10,000 x .471 x .529)) from the expected number of women—4,710—representing a probability of less than 2% for having 2,600 or fewer female employees.
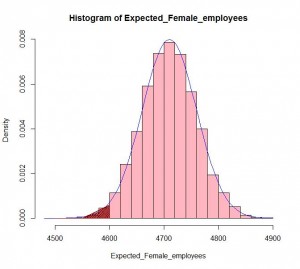
The agency with 4,600 female employees out of 10,000 is highly improbable if the agency workforce is drawn from a representative sample of the National Civilian Labor Force. The dark red portion indicates the probability of having 4,600 or fewer female employees.
Represented graphically in a plotted normal probability curve, an observed value of fewer than 4,600 female employees is highly improbable if the workforce is reflective of the overall population.
Comparing Specific Jobs to the Relevant Civilian Labor Force
Having a smaller number of employees from certain demographic groups could legitimately be driven by the fact that certain industries tend to employ fewer women, minorities, etc.
The EEOC suggests that agencies may compare specific jobs to Census benchmarks. By matching the OPM series code to the Census code on the EEOC’s Federal Sector Occupation Cross-Classification Table, and then looking up the available workforce from the Census for the specific industry, the expected benchmark specific to a particular job can be measured, rather than to the entire U.S. workforce. Benchmarking to a specific job can be a more accurate method of measuring workforce diversity.
Other benchmarks for agencies to consider include:
Fedscope – The Office of Personnel Management publishes individual-level demographic details of federal employees, including age and gender.
Partnership for Public Service – Published a report on the demographics of the federal workforce
Evaluating the Effect of Employment Policies or Practices
If the normal approximation to the binomial indicates that a group is underrepresented in a certain job category or agency-wide compared to the Census benchmarks, the agency may want to evaluate the specific hiring numbers to determine if the hiring process is disproportionately screening out certain groups. Using a 2 x 2 contingency table, and conducting a non-parametric statistical test, such as a Chi-squared or Fisher’s exact test, can help determine how improbable the observations are.
For example, an agency that hires 70 males and 26 females out of a total applicant pool of 670 males and 426 females indicates a selection rate of 10.4 percent for males and only 6.1% for females. A chi-squared test, which is available online, in statistical software or Microsoft Excel, indicates that such a disparity would occur less than 2% of the time.
Using Multivariate Regression Analysis to Test for Multiple Demographic Variables
If a non-parametric statistical test reveals a significant result, the next step may be to build a regression equation to evaluate how various demographic factors influence the probability of being hired/selected/promoted. Binary logistic regression can quantify how being in a certain demographic group (such as being female or minority) affects the probability of being hired compared to non-females/minorities. Hierarchical logistic regression can help control for non-diversity variables that could influence outcomes (such as education or experience level) to determine if being in a demographic group has a significant effect on determining outcomes, above the effects of education and experience.
Matthew Albucher is part of the GovLoop Featured Blogger program, where we feature blog posts by government voices from all across the country (and world!). To see more Featured Blogger posts, click here.


Leave a Reply
You must be logged in to post a comment.