
Last week, I began talking about the need to get direct feedback from your end users. I touched on a few topics such as Agile and Lean, but mostly stayed at the 50,000 feet level. This week, I want to dive into a topic known as A/B Testing. A/B testing is a method of experimenting with one variable within your product, and then capturing how your users react to changes to that variable. As we discussed last week, “your friends, family, and colleagues are too close to you to give you the truth,” and A/B testing is perhaps the best way to accurately capture feedback directly from people currently using your product.
But, before we get too deep into the concepts of A/B testing, I apologize, but I’m going to have to take you somewhere that…for many people…might not be a place that they are excited to visit. No, this might be a place where many of you have deep, repressed memories that you only revisit in your deepest, darkest nightmares. And that place…is High School Science Class! Back in those scary days full of acne, teenage angst, and awkward conversations with your parents*, when your teachers were rambling on in the front of the classroom about the experiment of the week, what they were trying to impress upon you is about singling out one parameter at a time, and watching how it reacts under different conditions. How does H2O react as the temperature falls below 32*F, or rises above 212*F?
Disclaimer – I loved high school. Everybody should be so lucky to go to Lake Forest High School, have the teachers and coaches I had, and get to grow up with the greatest group of people I could possible imagine. Spartan Pride baby! – end Disclaimer
Remember that? Kind of? Ok, good! So, with that flashback now complete, let’s apply that logic to performing an A/B test on your product. Now, you can’t get accurate feedback on your entire product, all at once. But, if you follow my advice from my first post, and release in small increments, you shouldn’t have a big product – at least initially anyway. You should be looking to refine specific elements in your design. I think maybe an example might be the easiest way to explain the concept, so let me try.
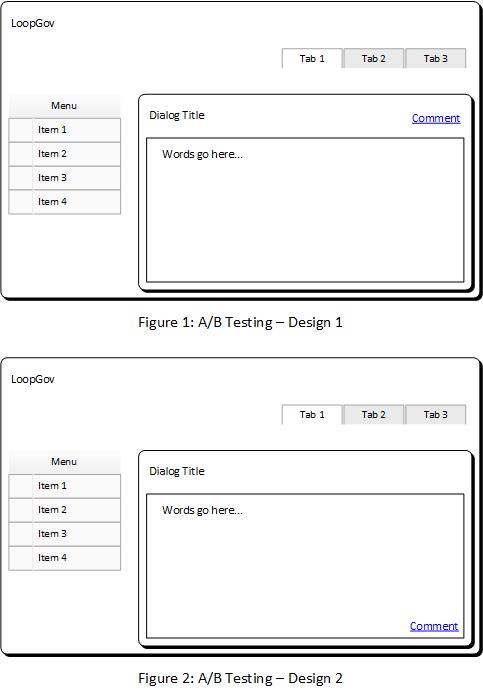
In our example below, my organization runs a fictional blog – LoopGov – and we are interested in refining our design to maximize user participation (i.e. we want more comments). Take a look at Figures 1 and 2 below, and you’ll see the design for my mock blogpost – where I have a menu on the left, tabs across the top, a title in the top left and some verbiage about where you’d expect the article to go. What you will also notice, is the comment link. In Figure 1, the Comment link is at the top of the post, and in Figure 2, the Comment link is at the bottom of the post. For the sake of the demonstration, Figure 1 is the original design that we launched the blog with, and Figure 2 is the updated design that we are “experimenting with.”
Now, you may be asking yourself, “Whoopity do – what does it all mean, Basil” in your best Austin Powers impersonation. Well, Austin, It means a lot. With this design, we can now capture simple metrics to determine which design the clientele likes better…
For A/B Testing, we will publish both of these templates to the website. We will then instruct our IT department to filter exactly ½ of our traffic to template 1, and exactly ½ of our traffic to template 2, so in theory, they’ll receive approximately the same number of page views. We will also instruct our IT department to capture which users visit which template, based on various methods, and then capture which users left comments using which template over a set period of time (say one week or one month). Then, using math (don’t worry, I’ll spare the High School flash back for this one), we will create metrics to determine which template had a higher percentage of users leave comments. To play out the scenario, let’s say Template 1 had 8 comments vs. 225 page views and Template 2 had 12 comments vs 224 page views. Then the ratio of comments per page views for Template 1 is 8 / 225 or 3% and the ratio of comments per page views for Template 2 is 12 / 224 or 5%.
Based on those metrics, you can definitely say that your end users like Template 2 better. So, after the experimentation period is complete, the metrics have been examined, and the verdict is in, Template 2 will replace Template 1 for EVERY page view, and you can expect a 2% bump in the number of comments your blog posts will receive. You have now gotten feedback directly from the end user, and applied it to provide a better product to your client base.
And that’s it. That’s all there is to A/B testing. Hopefully that makes some sense, and this example can help you refine a current product line that your organization promotes. If you have questions, or would like to brainstorm a little bit about how this can be applied to your organization, hit me up on Twitter or on Linked In – I follow GovLoop on both. OR, you can always leave a comment below, and I’ll get back to you. My passion is with helping people and organization make better software and better products, so, I’d love to hear from you and get a discussion going!
Until next week…
Steve Palmer is part of the GovLoop Featured Blogger program, where we feature blog posts by government voices from all across the country (and world!). To see more Featured Blogger posts, click here.


Leave a Reply
You must be logged in to post a comment.