
As organizations seek to apply fact-based decision making to their business operations, the ability to draw logical conclusions from vast quantities of data is more important than ever. Clustering analysis is a valuable statistical technique that quickly identifies similar groups that share like characteristics. Rather than manually parsing through data and evaluating relationships between variables through a subjective trial-and-error process, clustering algorithms streamline the grouping of observations that are most similar to generate affinity profiles.
The practical applications of clustering are vast. With the ability to identify groups in the data based on their shared characteristics, future customers, employees and stakeholders can be marketed and delivered products and services that are most likely to be pertinent to their specific needs.
Clustering algorithms are available in many commercial and open-source statistical programs, including R, SPSS and SAS. While understanding the methodology behind the mathematics of clustering is vital, advanced programming skills are not always necessary to begin applying clustering to a dataset. As just one example of many, the free R package “Rattle” incorporates a point-and-click graphical user interface to apply several clustering techniques to data.
Customer Sales Profiles
A perfect example of the utility of clustering can be demonstrated using the publicly accessible Wholesale Customer Dataset from the UCI Machine Learning Repository (as demonstrated by Divya Ganjoo and expanded upon here), which includes annual customer spending data from a grocery wholesaler in Portugal, listing the amount customers spent on various types of products, along with customer demographics.
In this dataset, clustering analysis can determine which types of products customers tend to purchase together, and which types of customers purchase certain products. The data can then be used to better market products to customers based on their demographics, and to advertise similarly purchased products in tandem.
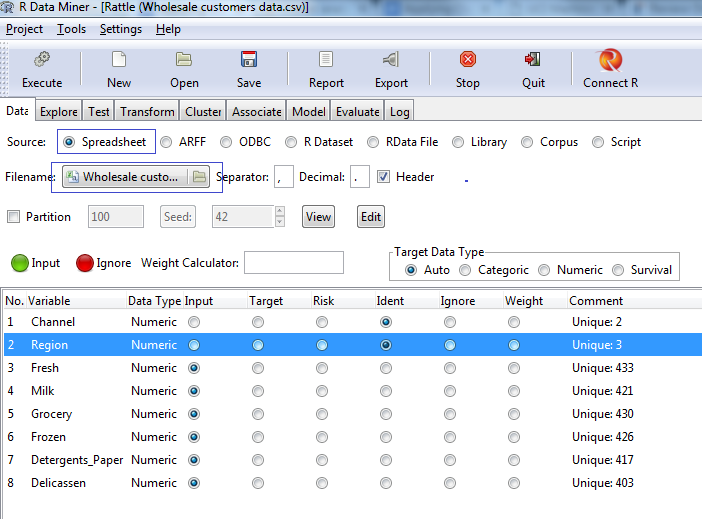
Using the open-source R package Rattle, loading in the dataset of the customer spending data is very intuitive. From there, clicking on the “cluster” tab presents several options, including determining the ideal number of clusters based on the within sum of squares metric (in this case, the ideal number is three). Also available is the option to automatically re-scale the variables to the range 0-1 to avoid bias for larger scaled variables (if only including sales data measured in monetary units, this step is unnecessary, but would be applicable if another variable scale were included, such as units sold), and various methods of clustering, including k-means clustering.
The open-source Rattle package in R provides a Graphical User Interface for users to conduct clustering and predictive modeling.
When running the k-means algorithm in Rattle, three distinct customer profiles emerge. The cluster centers are listed for each of the types of products and cluster assignments.
- Cluster 1: Prefers fresh foods, frozen foods, and deli.
- Cluster 2: Smaller volume customers.
- Cluster 3: Prefers grocery, milk and detergents/paper.
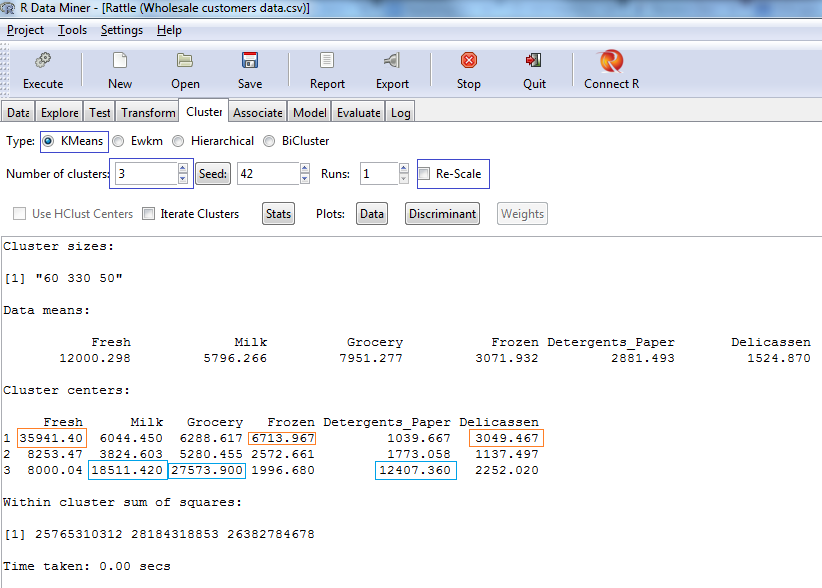
The k-means approach calculates cluster centers based on the average values across the variables, and assigns a cluster to each observation based on its closest cluster center. The output generates groups that are most mathematically homogeneous within the groups, and distinct between groups.
These results are illustrative in determining that raw ingredients like fresh/frozen foods and deli products tend to be purchased in large amounts by similar customers, whereas retail products like groceries, milk and detergents/paper are linked to another group of customers. Another group of customers tends to spend less overall on all products.
When mapped back to the customer demographics, the data further reveals that cluster 1 is mostly hotels, restaurants and cafés, who, logically, tend to order raw ingredients such as fresh and frozen foods for cooking in a sit-down restaurant setting, whereas cluster 3 is largely comprised of retail customers such as grocery stores, which would explain the large amount of consumer products purchased. The lower average spending cluster 2 is the largest group, and is comprised of about 74% hotels, restaurants, and cafes, which may indicate that the customer base is comprised of largely lower volume purchasers that are smaller restaurants rather than larger retailers.
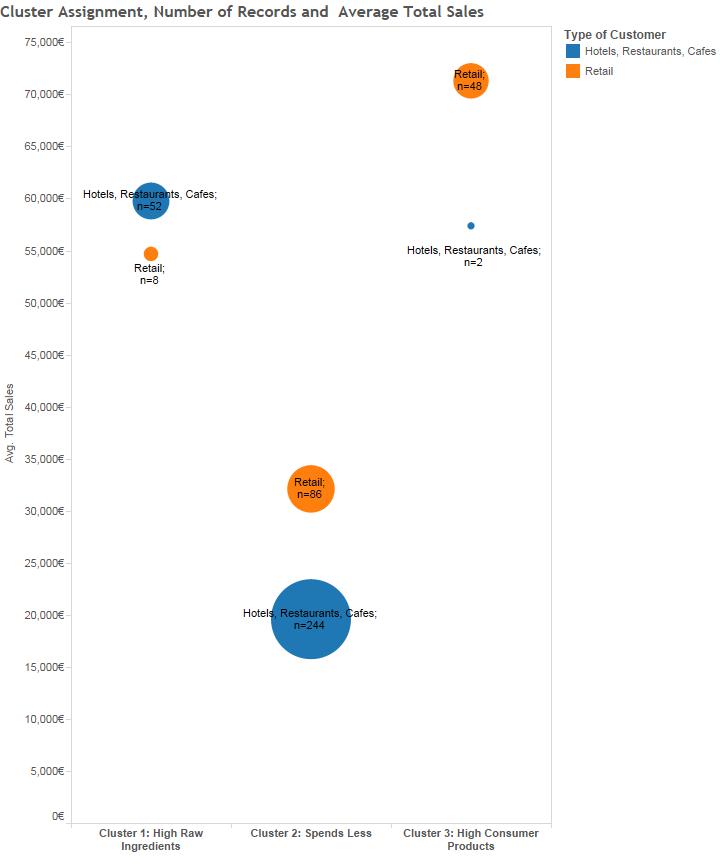
Clustering analysis helps develop affinity profiles based on customer behavior. The cluster assignments are listed in each column, while the type of customer (retail or restaurant) is color-coded. The average sales for each group are listed on the y-axis. While the lower-spending group (cluster 2) is more numerous, these customers spend less on average than those in cluster 1 or cluster 3. The chart also displays the large percentage of retail customers in cluster 3, and the large percentage of restaurant customers in clusters 1 and 2.
Equipped with this data on consumer spending patterns, marketing campaigns for this Portuguese wholesaler can be much more efficient and targeted, with new fresh and frozen products marketed towards restaurants and consumer products towards retailers. This approach can also help in predicting and ordering inventory by knowing that certain types of products are often ordered together.
Other Real-Life Applications of Clustering
Survey Analysis – After conducting an employee or customer survey, clustering can identify meaningful similarities between groups of respondents. Surveys that include Likert or rating scale questions on various topics can be loaded into a clustering algorithm to parse out groups that tend to rank certain questions higher. Just as in the wholesaler example, this approach can determine which portions of the survey are linked. For example, an employee engagement survey may find that groups of employees who feel more isolated also responded that they have lower engagement. When mapped back to employee demographic data, as in the wholesaler example, the groups that tend to make up the clusters found in the survey analysis can be more clearly defined.
Text Analytics and Unstructured Data – Unstructured data is a massive untapped resource for predictive analytics, and a prime target for clustering analysis. Using the example of HR data, terms that frequently appear together in employee individual development plans (IDPs) can be mapped into a document-term matrix and clustered for words that tend to appear together. The result can help determine the types of employees who list certain terms in their IDPs, and mapped back to employee outcomes such as performance evaluations, promotions and turnover.
Social Media – Many have recognized the potential revenue producing power of social media data, with companies using clustering to segment customers into affinity groups and market them products and services. Online behaviors such as membership in certain groups, liking or following pages and even the amount of user activity can be logged and used to determine personal profiles. Mining data from sites such as glassdoor.com may help understand what applicants and candidates think about the firm which can help improve recruiting effectiveness.
Employee Turnover Data – Just as predictive modeling can help determine why employees are leaving, clustering can develop persona profiles based on the types of employees who tend to have a higher risk of leaving, and their reasons for leaving. A clustering analysis can be used to identify cohorts of employees based on demographics, hire date, type of position, salary, and relative risk for leaving, to better understand employee turnover.
The views reflected in this column are solely those of the author.


Leave a Reply
You must be logged in to post a comment.