

![]() Since 1992, the Institute for Public Strategies (IPS) advances the health and safety of communities throughout the country and Mexico. The agency looks at policies and systems that play a role in alcohol and other drug (AOD) abuse, and factors that lead to crime and blight in neighborhoods. They work with communities to bring fresh produce and awareness of nutrition to underserved neighborhoods. They help facilitate self-sufficient, fully engaged community members into becoming champions for their neighborhoods by giving them tools to work with policymakers effectively and strategically.
Since 1992, the Institute for Public Strategies (IPS) advances the health and safety of communities throughout the country and Mexico. The agency looks at policies and systems that play a role in alcohol and other drug (AOD) abuse, and factors that lead to crime and blight in neighborhoods. They work with communities to bring fresh produce and awareness of nutrition to underserved neighborhoods. They help facilitate self-sufficient, fully engaged community members into becoming champions for their neighborhoods by giving them tools to work with policymakers effectively and strategically.
To do this, IPS created the A.C.T. Model – Approach to Community Transformation. This multiprong approach guides the agency’s efforts in working with policymakers, enforcement agencies, civic leaders, businesses, faith communities and residents to help realize the type of communities we want to live in.
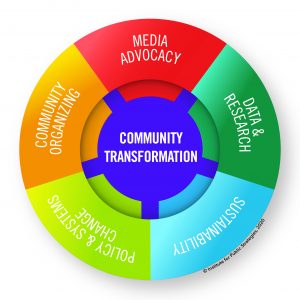
Geographic information systems (GIS) plays a large part in the success of its efforts. IPS uses this technology in all five components of the A.C.T. Model.
Data and Research
IPS’ work is evidence-informed: They rely on scientific knowledge, using a fair degree of flexibility to allow for unique conditions, to make sound decisions. The plethora of data out there is limitless. Accessing, using and interpreting the data has its challenges. GIS allows IPS to harness that data and look for trends and patterns to make sound decisions.
For its work in addressing health disparities among the Latino population in San Diego’s South Bay, IPS collected data from many different sources: health, crime, socioeconomic, education and environmental. The team then compiled the data into a geodatabase and mapped it on top of census tracts or ZIP codes to visually represent conditions in the South Bay. This decision-making tool enables the project team to identify communities most in need of intervention.
Media Advocacy
Getting IPS’ messaging into the news is key to impacting policy and systems change. Media advocacy is purposeful and strategic and not designed to only inform the public of policy impacts. Television and print news rely heavily on compelling videos, photographs and infographics, such as interactive maps, to help tell the story that the audience can relate to and empathize with.
For instance, in 2019, several college campuses around the country dealt with the tragic consequences of binge and underage drinking, particularly in fraternities. This included IPS’ own San Diego community. To put a face to each of the victims and to tell their stories, IPS created a map that pinpointed where each tragedy took place with pictures and text. The map was submitted with a news release to local media outlets to engage viewers in understanding the problem and advocating for policies at either the university administration level or the national fraternity organization level to protect college students.
Policy Buy-In and Development
Gaining support for a policy can be complicated. It requires awareness and buy-in of all stakeholders. GIS provides tools such as maps, data dashboards and story maps to help communicate policy goals in an easy-to-understand manner to stakeholders, such as decision-makers, community members, enforcement agencies and news media.
The Binge and Underage Drinking Initiative (BUDI) at IPS works on preventing harm from alcohol, especially among teens and young adults. To gain support from the harm prevention community for BUDI’s policy advocacy work, IPS created a story map to highlight the issue of alcohol problems in San Diego County and presented it at the Alcohol Policy Panel of San Diego County’s quarterly meeting. The story map combines pictures, graphs, maps and text to provide a multidimensional narrative of alcohol harm prevention efforts.
Sustainability
For a policy to succeed, it requires community awareness and regular and consistent enforcement. Compliance checks ensure that businesses, for example, are following municipality- or state-mandated regulations that keep neighborhoods free from harm. This helps keep businesses accountable and builds trust among community members.
GIS allows IPS to collect its own data to make sure policies are upheld. For example, it created an app that assesses a bar or restaurant’s compliance with the state alcohol regulatory agency’s rules on responsible beverage sales and service.
In the past, observers recorded their assessment on paper. By digitizing the assessment so that it is accessible on a mobile device, the user can discretely record their observations and immediately build upon the underlying database. The database is then used to track the policy’s enforcement over time. It also informs the AOD prevention community if a bar has done a commendable job at preventing over-service of alcohol, or if intervention is necessary to advise bar owners and managers of lapses in responsible business practices. The process is now more efficient and less cumbersome for data recorders.
Community Organizing
Communities that rally around an issue will find success when they fully understand the underlying reasons for the problems they encounter. Maps help community groups grasp how a geographic location is related to disease, crime and other threats to health and safety.
Team members in IPS’ Pomona office are food security and nutrition champions in their city. Green space and urban gardens are found to promote nutrition and physical and mental health. But what happens when children and teens do not have access to them?
To answer this question, IPS first mapped out the locations of healthy food sources (farmer’s markets, urban gardens, fresh food markets, etc.) and fast food restaurants. The locations’ proximity to a local middle school was symbolized through different colored lines – blue for healthy and nutritious sources, red for unhealthy fast food. The resulting map showed that the red lines were shorter than the blue lines, meaning more fast food restaurants were closer to the middle school than healthy food sources. This demonstrated that students were at an increased risk of dietary problems and resulting diseases, because healthy foods were not as accessible as non-healthy options. Visualizing the data this way prompted support for establishing more urban gardens near the school and nutrition education at the school.
Because GIS is both an art and a science, IPS continues to promote healthy and safe communities by leveraging the technology’s creative and analytical tools, making this dynamic system appealing to anyone who has a stake in envisioning a brighter future for their communities.
Meredith Gibson is a GovLoop Featured Contributor. She uses the power of media advocacy and geographic information systems to promote systems and policy changes that contribute to healthy, safe and vibrant communities in San Diego County. Meredith is a media director at the Institute for Public Strategies, a non-profit organization that addresses equity in public health, particularly around substance abuse prevention. She writes news releases, collaborates on opinion editorials and pitches ideas and spokespersons to news outlets, amassing media coverage at the local and national levels. She also authors story maps and analyzes spatial data to inform policy decisions.


Leave a Reply
You must be logged in to post a comment.