


The theme of this year’s Disability Pride Month is “The World Works Better With Us,” so it is a good time to discuss disabilities and employment.

People with disabilities can be helpful employees. According to Forbes.com, inclusive workplaces are improved by “higher employee retention, stronger morale, and enhanced brand reputation.” It also said that compared to workers without disabilities, employees with disabilities “tend to be more loyal, consistent, and reliable employees” and “had lower turnover rates, better safety records, and equal or higher productivity.” Decreased turnover would save employers time and money.
Employment is associated with the following benefits for people with disabilities, explained the Forbes article: “an improved quality of life, higher incomes, more self-confidence, an expanded social network, and an increased sense of community.” Employment also helps the mental health of people with intellectual and developmental disabilities and individuals with disabilities in general by improving self-esteem (providing them “a sense of capability and purpose”), decreasing depression and anxiety, offering social inclusion, and increasing “[a]utonomy and [i]ndependence.”
On the other hand, prolonged unemployment can cause preventable mental health problems and suicides. According to a 2019 study, “The disabled and those unable to work were nearly 2.4 times more likely to have higher suicide deaths than the employed.”
However, people with disabilities face barriers to employment. They include discrimination, accessibility challenges, income and asset limits for public benefits, transportation difficulties, and biases.
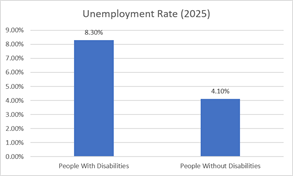
Nationwide, people with disabilities struggle with securing employment. In 2025, individuals with disabilities (8.3%) had more than double the unemployment rate of people without them (4.1%). The graph below shows the difference.
The unemployment rate is a main employment-related indicator, but it limited and makes employment look better than it is. It accounts for people who are working or out of work yet looking for employment. It does not count people who are not working and who are not looking for work. It also excludes discouraged workers, who would like jobs and are able to work but have stopped actively looking for employment.
The Bureau of Labor Statistics said that these individuals “were not currently looking for work specifically because they believed no jobs were available for them or there were none for which they would qualify.” Another way of looking at the situation is the employment rate, which accounts for all people of working age. The employment rate shows a different picture, a stark one.
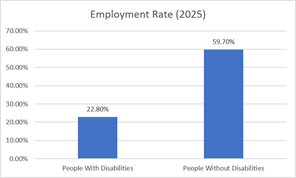
A substantially higher percentage of people without disabilities than with them worked in the U.S. In 2025, the total percentage of people with disabilities who worked was 22.8%. The total percentage of men with disabilities who worked was 25%, and of women was 20.8%. In contrast, in 2025, the percentages for people without disabilities who worked were: 65.2% (total), 70.5% (men), and 60.1% (women). The graph below shows difference.
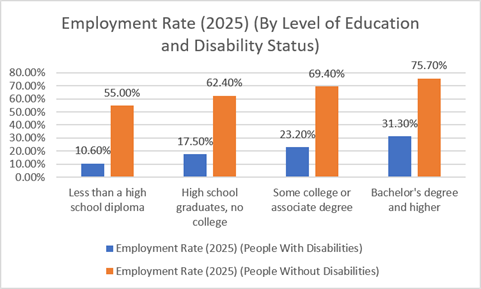
Furthermore, while education increased the chance of employment for people with and without disabilities in 2025, education did not close the employment rate gaps between individuals with and without disabilities. People without disabilities who had earned below a high school degree had almost double the employment rate of most people with disabilities who had at least a bachelor’s degree. The following graph shows the employment rates relating to level of education and disability status.
Other employment statistics show major disparities between people with and without disabilities:
- Annual earnings (2023) – with disability ($51,000); without disability ($61,200)
- Percent working part-time (2025) – with disability (30%); without disability (17%)
- Self-employed (2025) – with disability (9.1%); without disability (5.9%)
In addition, people with disabilities had a larger chance than individuals without disabilities of working in retail, office, and service jobs. They were less likely than people without disabilities of working in management and professional positions.
According to the Bureau of Labor Statistics, in 2025, a higher percentage of people with disabilities worked for state and local government than for the federal government. The following are exact percentages:
- Federal – people with a disabily (3.4%); people without a disability (2.4%)
- State – people with a disability (5.2%); people without a disability (4.7%)
- Local – people with a disability (5.4%); people without a disability (6.2%)
Learn about the employment disparities between people with different types of disabilities in my next piece, “Employing People With Disabilities: How Type of Disability Matters — Part 2.”
Miriam Edelman, MPA, MSSW, is a Washington, D.C.,-based policy professional. Her experience includes policy work for Congress. Miriam’s undergraduate degree is from Barnard College, Columbia University, with majors in political science and urban studies. She has a master’s in public administration from Cornell University, where she was inducted into the national honorary society for public administration. She has a master’s of science in social work (focusing on policy) from Columbia University. She is a commissioner of the DC Commission on Persons with Disabilities. Miriam aims to continue her career in public service. She is especially interested in democracy, civic education, District of Columbia autonomy, diversity, health policy, women’s issues, and disabilities.



Leave a Reply
You must be logged in to post a comment.