


In my last piece, “Employing People With Disabilities — Part 1,” I discussed, in general, the employment of people with disabilities. This article describes how employment varies by type of disability.

The American Community Survey categorizes disabilities as:
- Hearing difficulty: deaf or having serious difficulty hearing (DEAR)
- Vision difficulty: blind or having serious difficulty seeing, even when wearing glasses (DEYE)
- Cognitive difficulty: because of a physical, mental, or emotional problem, having difficulty remembering, concentrating or making decisions (DREM)
- Ambulatory difficulty: having serious difficulty walking or climbing stairs (DPHY)
- Self-care difficulty: having difficulty bathing or dressing (DDRS)
- Independent living difficulty: because of a physical, mental or emotional problem, having difficulty doing errands alone such as visiting a doctor’s office or shopping (DOUT)
People reporting any of those characteristics are viewed as having a disability.
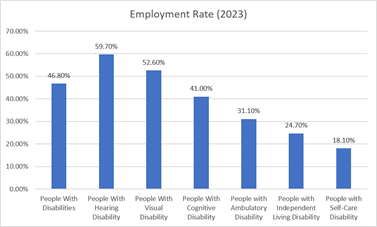
Disabilitystatistics.org reported on the different employment rates by type of disability in 2023. The employment rate of individuals without disabilities was 81.5%, while the overall rate for people with a disability was just 46.8%. However, people specifically with hearing (59.7%) or visual (52.6%) disabilities were more likely to have jobs than people with other disabilities.
The following disability types each had lower employment rates: cognitive (41.0%), ambulatory (31.1%), independent living (24.7%), and self-care (18.1%). The graph below shows the differences.
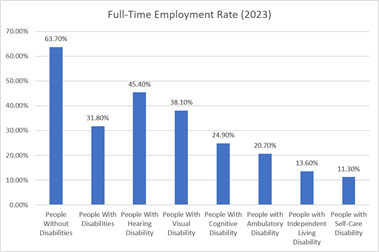
Full-time employment rates in 2023 for the same groups of individuals were even lower, but ranked the same. Overall, 63.7% of people with no disability were fully employed. That rate dropped for people with disabilities: hearing (45.4%), visual (38.1%), any disability (31.8%), cognitive (24.9%), ambulatory (20.7%), independent living (13.6%), and self-care (11.3%). The following graph shows the differences.
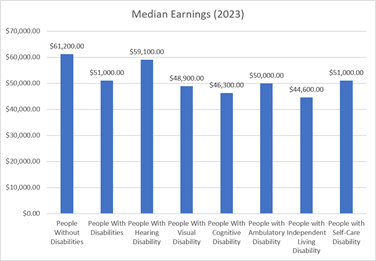
Median earnings in 2023 vary by category also and follow similar trends. The median average earnings (in thousands of dollars) are: no disability ($61.2), hearing ($59.1), self-care ($51), any disability ($51), ambulatory ($50), visual ($48.9), cognitive ($46.3), and independent living ($44.6). The following graph shows those differences.
Other ways of describing disabilities involve intellectual and developmental disabilities (IDD) and physical disabilities. People with IDD, which are conditions that usually exist from birth, may have especially negative employment outcomes. At least 80% of this population in the U.S. is unemployed.
Just 19.1% of the approximately 6.5 million people with intellectual disabilities in the U.S. are employed. Twenty-eight percent of individuals with intellectual disabilities never had a job. Individuals with those disabilities have a 17% unemployment rate, which is nearly quadruple the rate of the overall population. They also earn substantially less than people without disabilities.
Autism is a significant employment challenge. Key autism traits include difficulty with communication and social interaction, and autistic people, in particular, have poor employment outcomes. One in 127 people are autistic, and up to 85% of autistic people are unemployed, a much higher percentage than people with other disabilities. According to Neurolaunch, “an autistic adult is up to 17 times more likely to be unemployed than a neurotypical adult, even after controlling for education level.”
Just 14% to 16% of autistic people are fully employed, although they may work as well as, if not better than, non-autistic individuals. They often are overqualified for their roles. On average, however, autistic individuals earn one-third less than people without disabilities. That’s the highest pay gap of every disability.
Learn how to increase the number of employees with disabilities in your agency in my next piece, titled “Hiring Practices That Help People With Disabilities Contribute Their Talents.”
Miriam Edelman, MPA, MSSW, is a Washington, D.C.,-based policy professional. Her experience includes policy work for Congress. Miriam’s undergraduate degree is from Barnard College, Columbia University, with majors in political science and urban studies. She has a master’s in public administration from Cornell University, where she was inducted into the national honorary society for public administration. She has a master’s of science in social work (focusing on policy) from Columbia University. She is a commissioner of the DC Commission on Persons with Disabilities. Miriam aims to continue her career in public service. She is especially interested in democracy, civic education, District of Columbia autonomy, diversity, health policy, women’s issues, and disabilities.



Leave a Reply
You must be logged in to post a comment.