
The 2020 presidential election was unique, with the voting experiences looking very different for citizens due to the COVID-19 pandemic. Jurisdictions across the country faced a complete disruption of their normal operations, having to implement more robust mail-in, absentee, and early voting operations.
This disruption drove the need to modernize traditional, often time-consuming election operations. It was essential for jurisdictions to work efficiently, provide access to real-time election results, and provide transparency to their residents.
The second-largest county in Utah, Utah County, transformed its outdated election processes into a location-enabled system suited for modern-day elections. The elections department collaborated with the GIS team to reduce staff time typically devoted to updating election results and streamlined the processes to collect ballots from drop boxes throughout the 2,144-square-mile county.
Real-Time Results
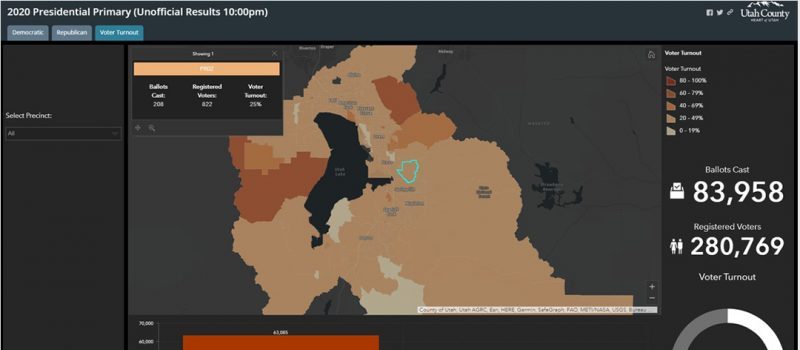
The county had previously used a standard, tabulated document with the number of votes cast per candidate. This system lacked the basic visualization tools to present which candidates won which precincts. Utah County GIS systems analyst Andrea Befus understood the need to create an elections dashboard allowing residents to view results in near real time in an easy-to-understand format.
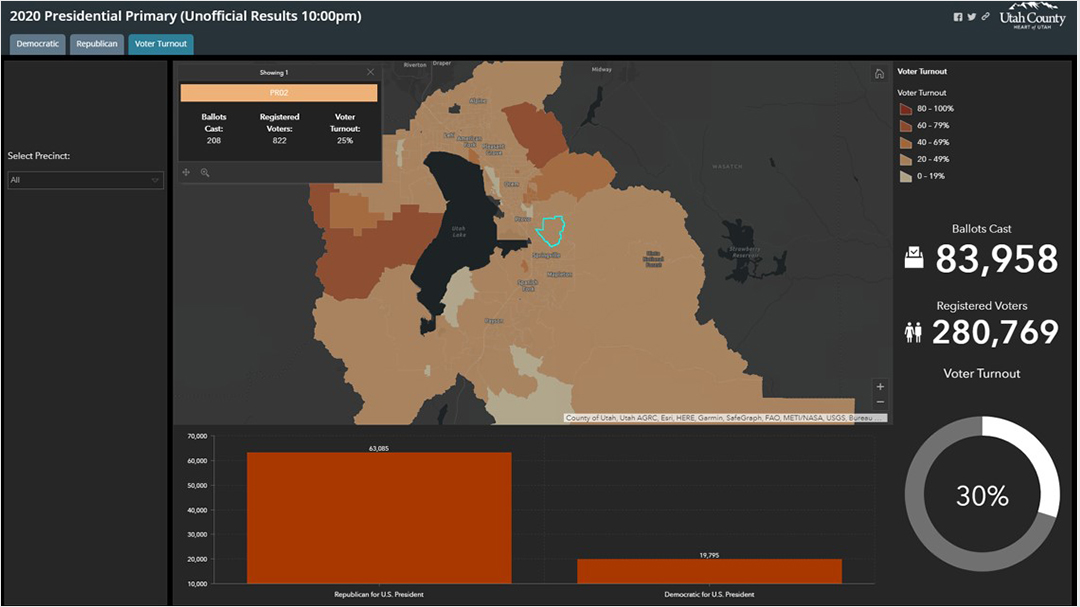
Voter turnout is displayed on a dashboard for Utah County.
Using a location intelligence dashboard, Befus could input voter data, including turnout, party affiliation, number of total ballots cast, election night results and other essential information. Voters could use the app to go back to any recent election, filter out data, and do their own analysis, enabling public interaction with county data.
According to Befus, staff saved about four hours’ worth of time throughout the night of Utah’s 2020 primary election by updating the public-facing dashboard as results came in. What was once a 50-minute process can now be provided in only 3 minutes with information on which area’s candidates are winning.
“It was so successful in our municipal elections that several cities abandoned their own results tools and directed voters to our website,” said Utah County Clerk/Auditor Amelia Powers Gardner. “The mapping feature provides a visual display of the votes tabulated. The tool allows voters to zoom in on their specific precinct to see how many voters participated and how votes were cast.”
Updating election results through a GIS dashboard freed up hours of staff time, which they could then reallocate to collect ballots.
Managing Security
Voting by mail has been the norm in Utah for several years. Utah County election officials streamlined the tracking, dispatch, and collection of ballot-gathering data. This minimized any doubts about the location of ballots during the collection process. While voting by mail was the encouraged method for the entire country for this year’s election, ballot security remained a public concern.
Utah County had ballot drop boxes near strategic locations, such as libraries, recreational centers, and city offices, for registered voters to place their ballot envelopes. To maintain security, Utah County’s GIS department used a mobile app allowing staff to capture photos, text, and other data for dropbox ballot tracking. To ensure that every ballot was accounted for, the county equipped each mobile worker with the app.
As staff arrived at their assigned dropbox, they dropped a point on a map with a timestamp, weighed ballots, and reconfirmed the exact location and time. Once staff returned, the election officials weighed each bag. This ensured that the number of ballots matched the bag’s weight captured by the application, double-checking that ballots were not lost in transit.
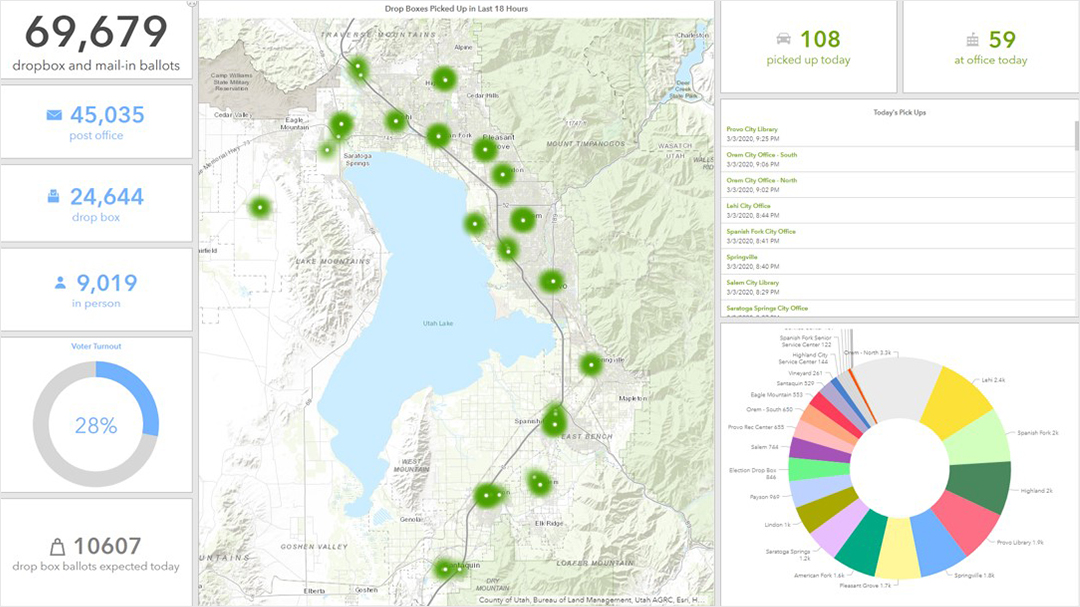
The dashboard shows Utah County ballot drop box mobile staff locations.
“The new dropbox tracking and mapping feature allow[s] us to anticipate the volume of ballots and ensure that we are staffed appropriately,” said County Clerk Gardner. These measures illustrate transparency and accountability to voters. If a voter called the elections department inquiring about their ballot’s safety, the staff was able to confirm a timestamp and location data. Dashboards were also instrumental in maintaining transparency with the public.
“One of the most useful dashboards this year was the newly created Election Stats dashboard because [County Clerk Gardner] could pull it up on her phone during interviews with the press and give real-time stats to the public while on camera,” Befus said. “It was a simple, easy, and powerful way for her to communicate the progress the Elections Department was making throughout election night.”
Gardner continued, “In today’s election environment, security at every step of the process is crucial to ensure public trust and confidence in our system — the very system that undergirds democracy itself.”
Richard Leadbeater is Esri’s State/Provincial Government Industry Solutions Manager. Richard focuses on developing tools and solutions that address the administrative functions of policy, elections, redistricting, and government business process. He is passionate about helping governments gain the greatest value from the data they generate. Prior to joining Esri in 1997, he worked at the Washington Suburban Sanitary Commission, the seventh largest public water and wastewater utility in the US, where he developed and implemented GIS, computer aided drafting and design, and document imaging technologies.


Leave a Reply
You must be logged in to post a comment.